Monitor Applications 24/7 with CloudWatch
Harness 24/7 Service Guard monitors your live applications, catching problems that surface minutes or hours following deployment. For more information, see 24/7 Service Guard Overview.
You can add your CloudWatch monitoring to Harness 24/7 Service Guard in your Harness Application Environment. For a setup overview, see Connect to CloudWatch.
This section assumes you have a Harness Application set up and containing a Service and Environment. For steps on setting up a Harness Application, see Application Checklist. You cannot configure CloudWatch 24/7 Service Guard for AWS ALB and AWS EKS.
Before You Begin
- Set up a Harness Application, containing a Service and Environment. See Create an Application.
- See the CloudWatch Verification Overview.
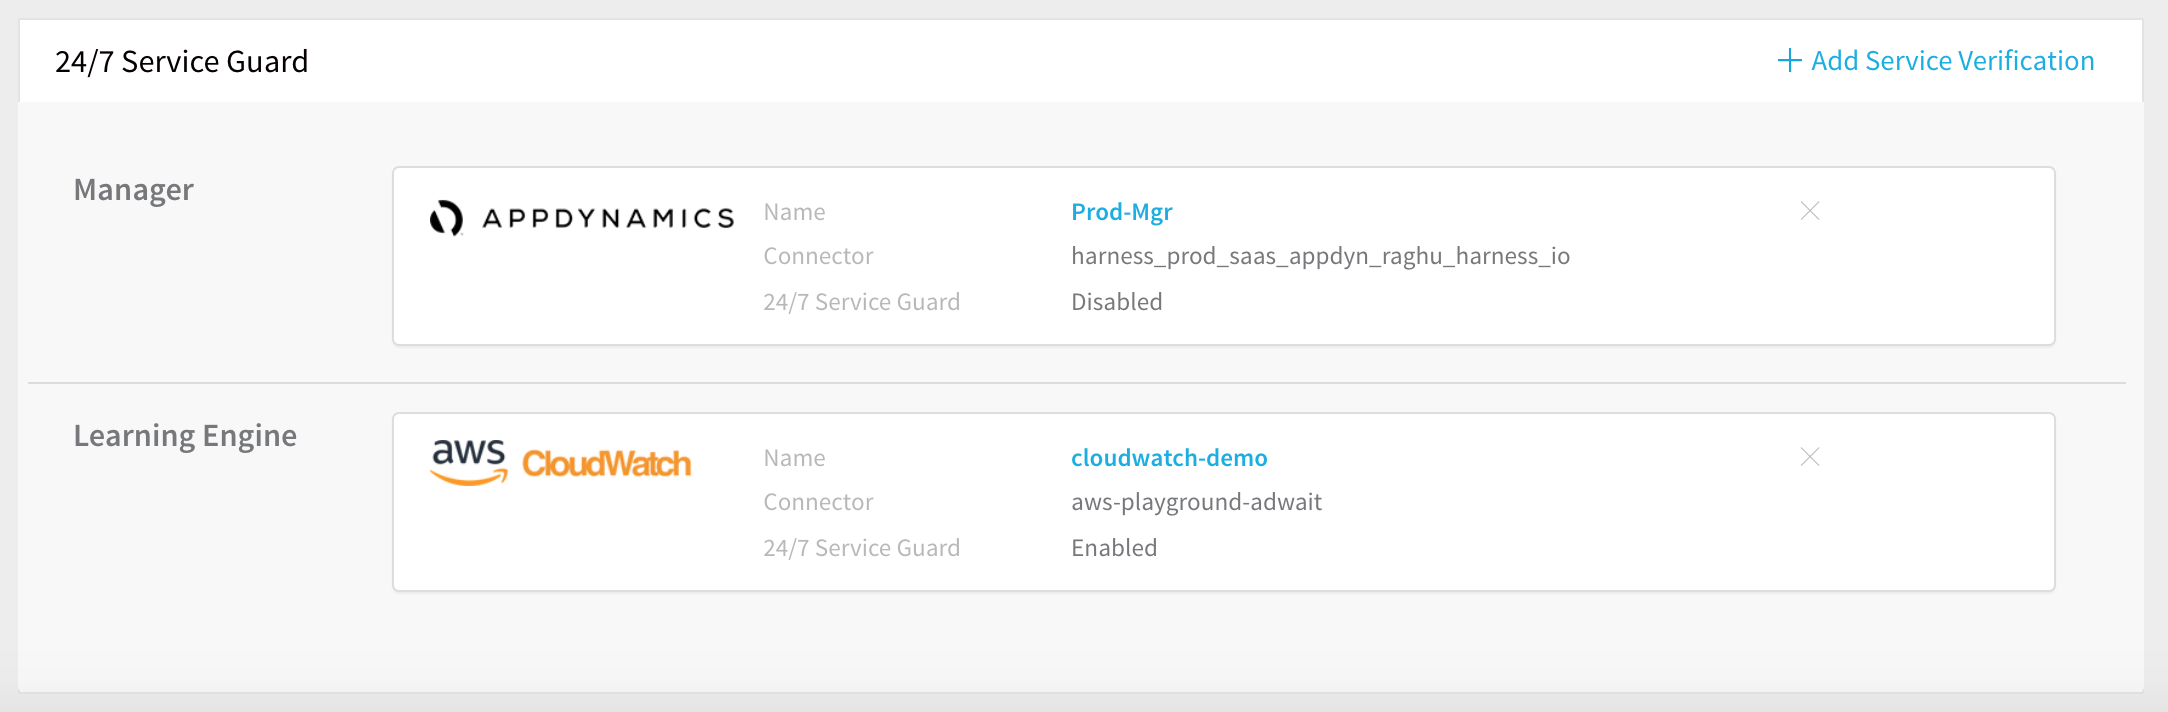
Visual Summary
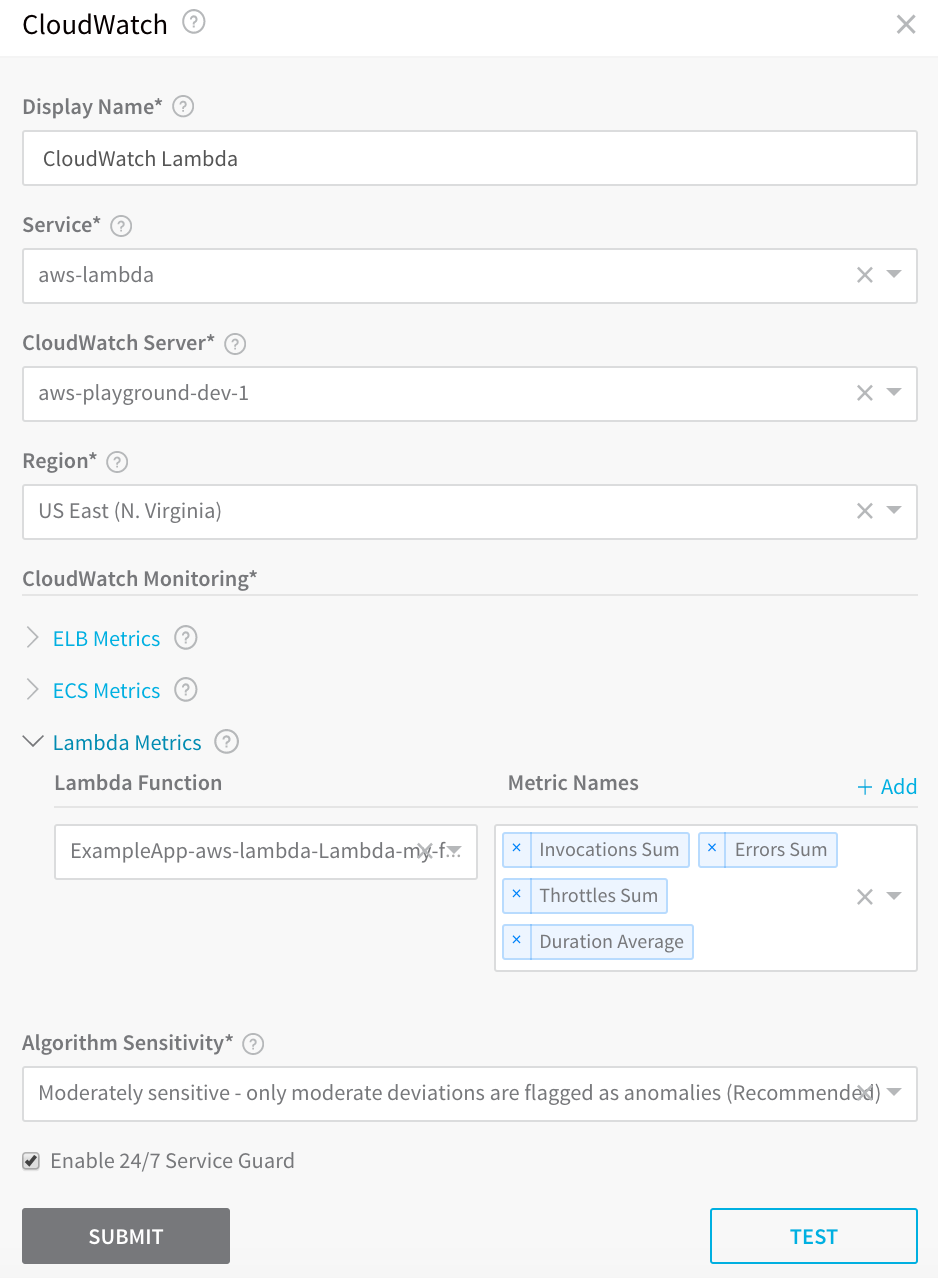
Here's an example of a 24/7 Service Guard configuration for CloudWatch.
Step 1: Set up 24/7 Service Guard for CloudWatch
Ensure that you have added CloudWatch as a Harness Verification Provider, as described in Connect to CloudWatch.
In your Harness Application, ensure that you have added a Service, as described in Services. For 24/7 Service Guard, you do not need to add an Artifact Source to the Service, or configure its settings. You simply need to create a Service and name it. It will represent your application for 24/7 Service Guard.
In your Harness Application, click Environments.
In Environments, ensure that you have added an Environment for the Service you added. For steps on adding an Environment, see Environments.
Click the Environment for your Service. Typically, the Environment Type is Production.
In the Environment page, locate 24/7 Service Guard.
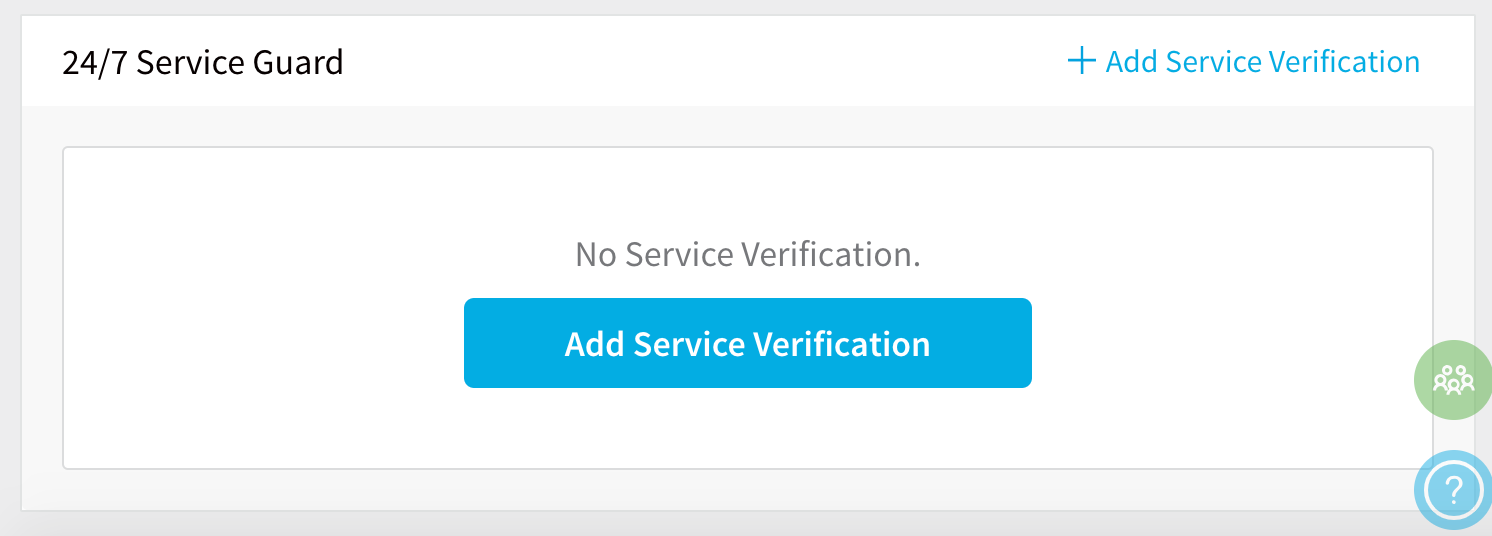
In 24/7 Service Guard, click Add Service Verification, and then click CloudWatch. The CloudWatch dialog appears.
For 24/7 Service Guard, the queries you define to collect logs are specific to the application or service you want monitored. Verification is application/service level. This is unlike Workflows, where verification is performed at the host/node/pod level.
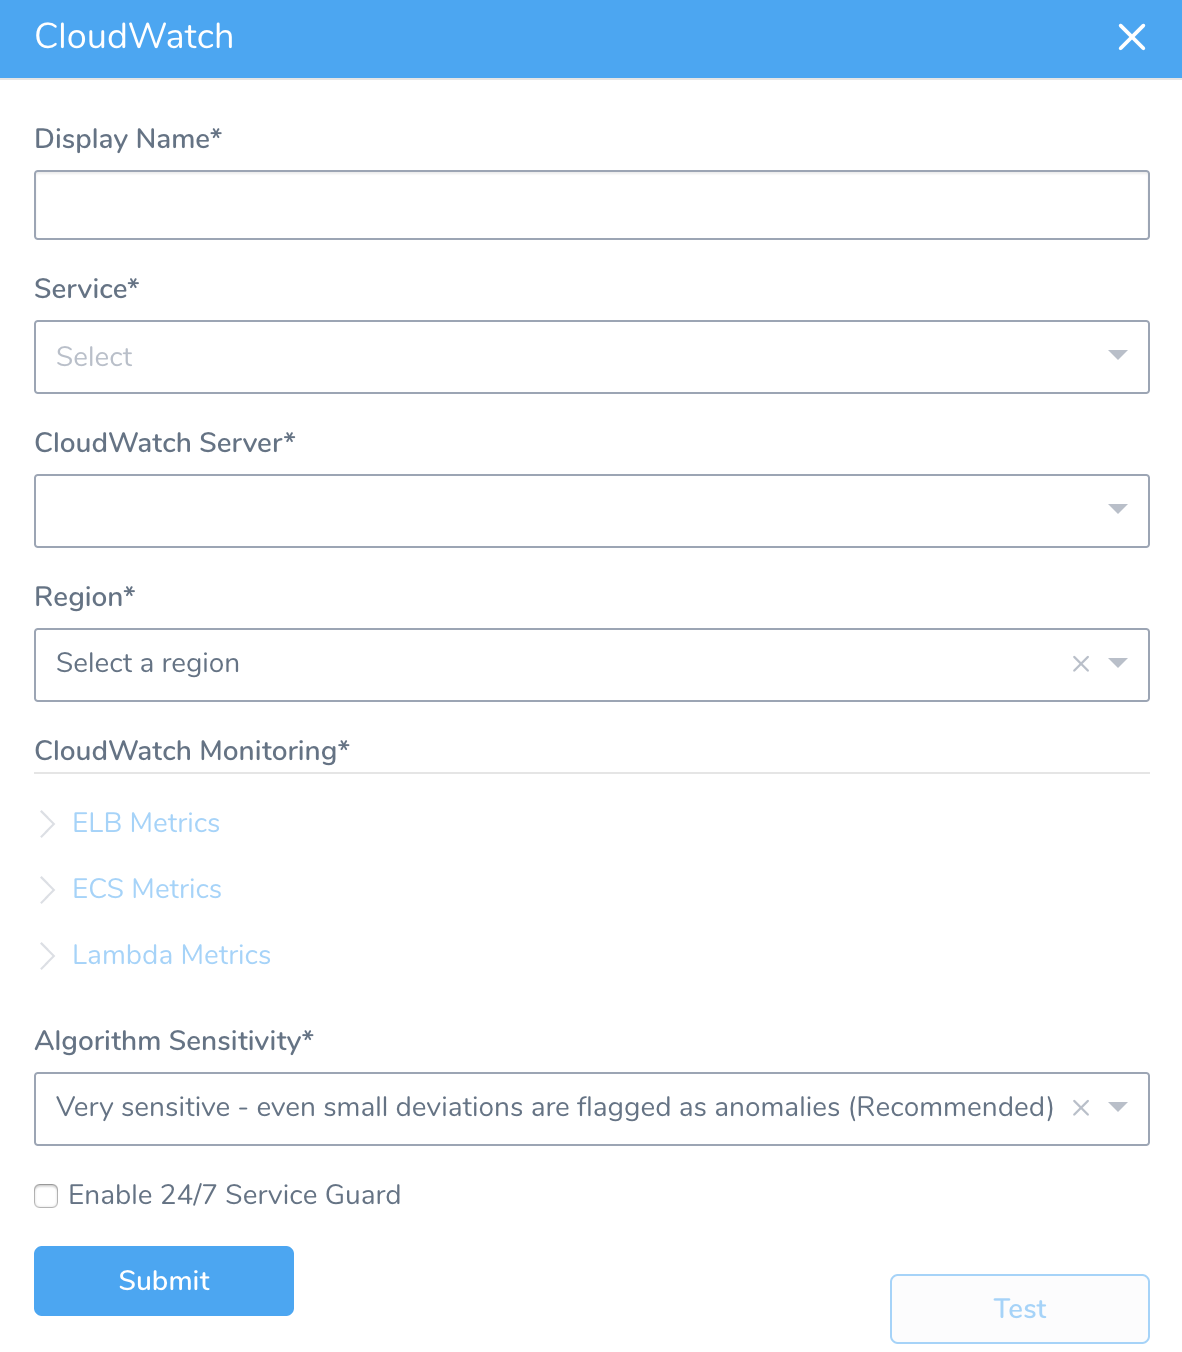
Step 2: Display Name
The name that will identify this service on the Continuous Verification dashboard. Use a name that indicates the environment and monitoring tool, such as CloudWatch.
Step 3: Service
The Harness Service to monitor with 24/7 Service Guard.
Step 4: CloudWatch Server
Select the CloudWatch Verification Provider to use.
Step 5: Region
Select the AWS region where the ECS and/or ELB are located.
Step 6: ELB Metrics
Click Add for each load balancer you want to monitor. For more information, see Elastic Load Balancing Metrics and Dimensions from AWS.
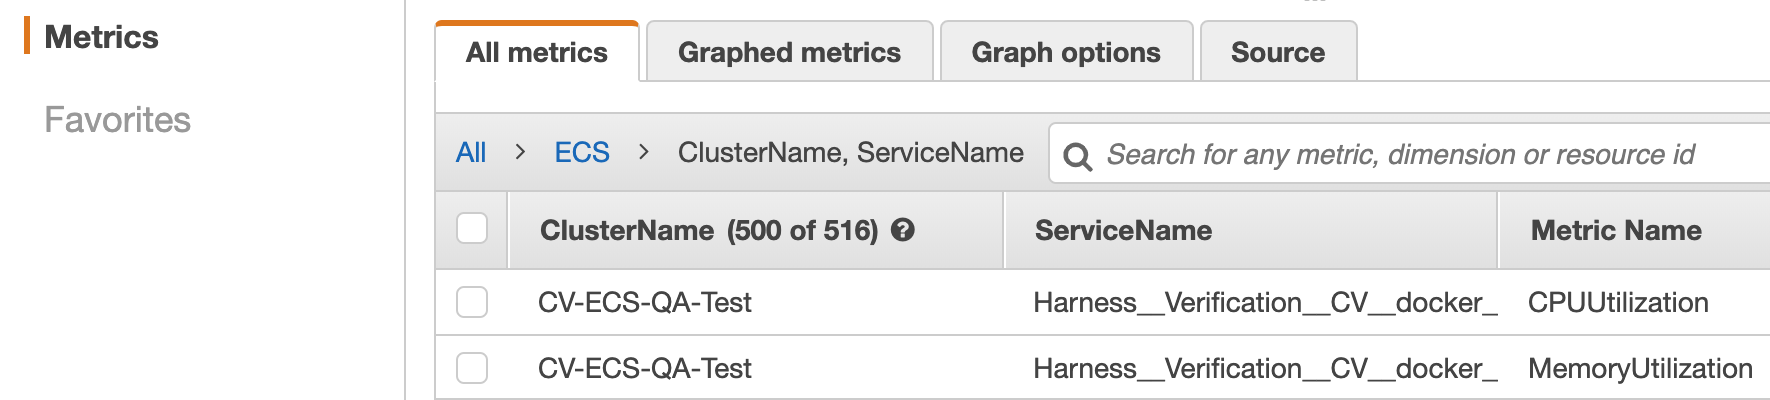
Step 7: ECS Metrics
This Cluster drop-down menu contains the available ECS clusters. The Metrics drop-down contains the available metrics. Select the metrics to monitor.
You can see the available metrics in CloudWatch.
 For more information, see Using Amazon CloudWatch Metrics from AWS.
Step 8: Lambda
Select the Lambda function and metrics to monitor. The functions displayed are from the region you selected. Only functions that have been deployed are displayed.
Step 9: Algorithm Sensitivity
See CV Strategies, Tuning, and Best Practices.
Step 10: Enable 24/7 Service Guard
Enable this setting to turn on 24/7 Service Guard. If you just want to set up 24/7 Service Guard, but not enable it, leave this setting disabled.
When you are finished, the dialog will look something like this:

Step 11: Verify Your Settings
- Click TEST. Harness verifies the settings you entered.
- Click SUBMIT. The CloudWatch 24/7 Service Guard to configured.
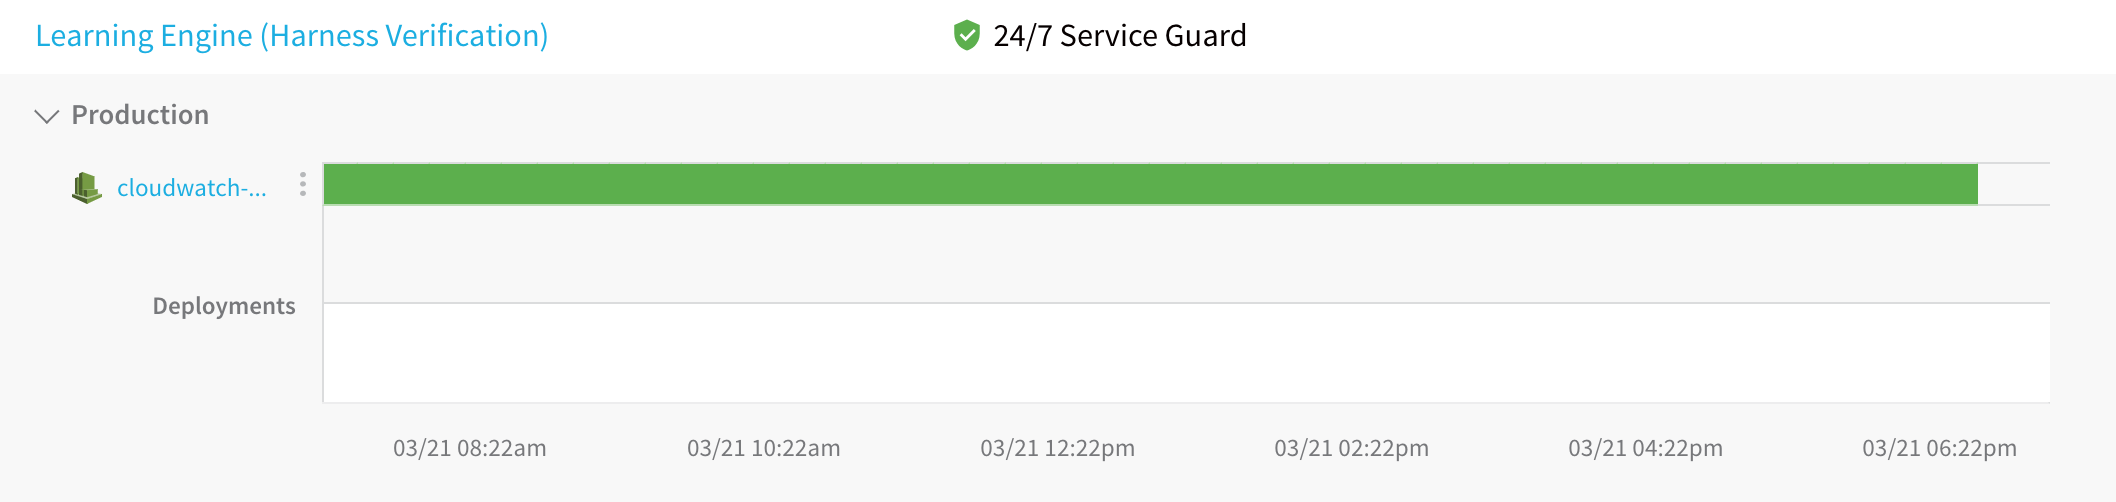
To see the running 24/7 Service Guard analysis, click Continuous Verification.
The 24/7 Service Guard dashboard displays the production verification results.
For information on using the dashboard, see 24/7 Service Guard Overview.