Monitor Harness Self-Managed Enterprise Edition
You can monitor your Harness Self-Managed Enterprise Edition installation and receive alerts on metrics such as CPU, memory, and disk usage.
Monitoring Overview
The Harness Self-Managed Enterprise Edition monitoring options available depend on whether you are running Harness Self-Managed Enterprise Edition - Virtual Machine or Kubernetes Cluster.
Harness Self-Managed Enterprise Edition - Virtual Machine comes with built in monitoring using Prometheus, Grafana, and Alertmanager, but Harness Self-Managed Enterprise Edition - Kubernetes Cluster requires that you set up monitoring on your own.
Monitoring Harness Self-Managed Enterprise Edition - Virtual Machine
Monitoring is included in Harness Self-Managed Enterprise Edition - Virtual Machine by default.
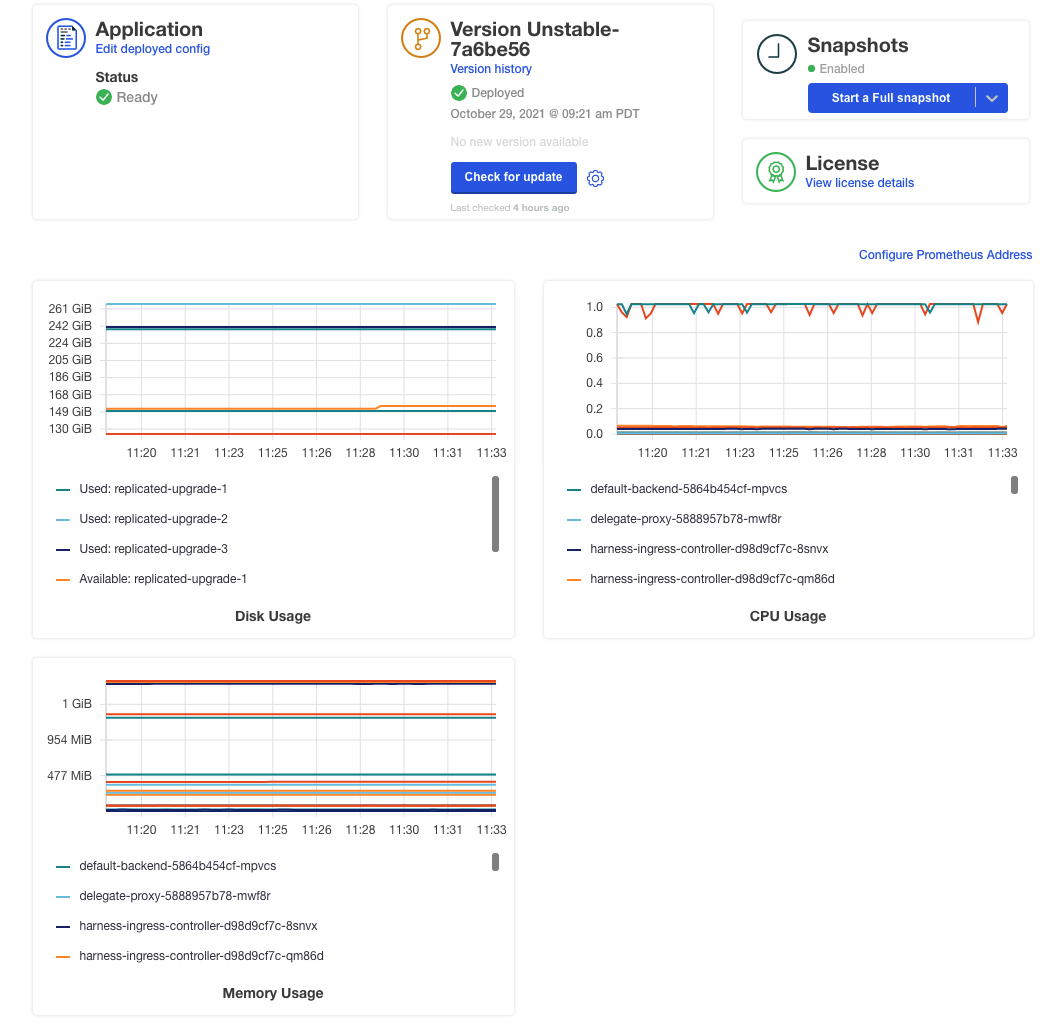
The KOTS admin tool for a running version of Harness Self-Managed Enterprise Edition - Virtual Machine displays Prometheus monitoring:
 When you installed Harness Self-Managed Enterprise Edition - Virtual Machine, you were provided with Prometheus, Grafana, and Alertmanager ports and passwords in the output of the installer. For example:
The UIs of Prometheus, Grafana and Alertmanager have been exposed on NodePorts 30900, 30902 and 30903 respectively.
To access Grafana use the generated user: xxxxx password of admin: xxxxx.
To view these addresses, log into the VM running Harness, and then view the Kubernetes services running in the monitoring namespace:
kubectl get svc -n monitoring
The output will be something like this:
NAME                    TYPE        CLUSTER-IP    EXTERNAL-IP   PORT(S)                      AGE
alertmanager-main       NodePort    10.96.2.240   <none>        9093:30903/TCP               282d
alertmanager-operated   ClusterIP   None          <none>        9093/TCP,9094/TCP,9094/UDP   282d
grafana                 NodePort    10.96.2.252   <none>        3000:30902/TCP               282d
kube-state-metrics      ClusterIP   None          <none>        8443/TCP,9443/TCP            282d
node-exporter           ClusterIP   None          <none>        9100/TCP                     282d
prometheus-adapter      ClusterIP   10.96.1.45    <none>        443/TCP                      282d
prometheus-k8s          NodePort    10.96.2.94    <none>        9090:30900/TCP               282d
prometheus-operated     ClusterIP   None          <none>        9090/TCP                     282d
prometheus-operator     ClusterIP   None          <none>        8080/TCP                     282d
Prometheus
The Prometheus port number is taken from the prometheus-k8s service (in this example 30900).
Combine that port number with the public IP for Harness Self-Managed Enterprise Edition and you have the Prometheus endpoint.
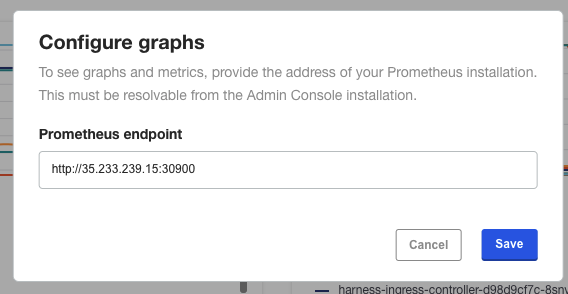
If you have a load balancer configured, then configure it to support the prometheus-k8s port number.In the KOTS admin tool, in Application, click Configure Prometheus Address.
In Configure graphs, enter the URL using the public IP and the Prometheus port number.
 Click Save. The graphs appear.
Grafana
The Grafana port is listed by running kubectl get svc -n monitoring:
grafana NodePort 10.96.2.252 <none> 3000:30902/TCP
Combine that port number with the public IP for Harness Self-Managed Enterprise Edition and you have the Grafana endpoint. For example http://35.233.239.15:30902.
Log into Grafana using the generated username and password you received when you installed Harness Self-Managed Enterprise Edition:
To access Grafana use the generated user: xxxxx password of admin: xxxxx.
If you do not have the username and password, log into the VM hosting Harness Self-Managed Enterprise Edition and run the following:
kubectl get secrets grafana-admin -n monitoring -o yaml
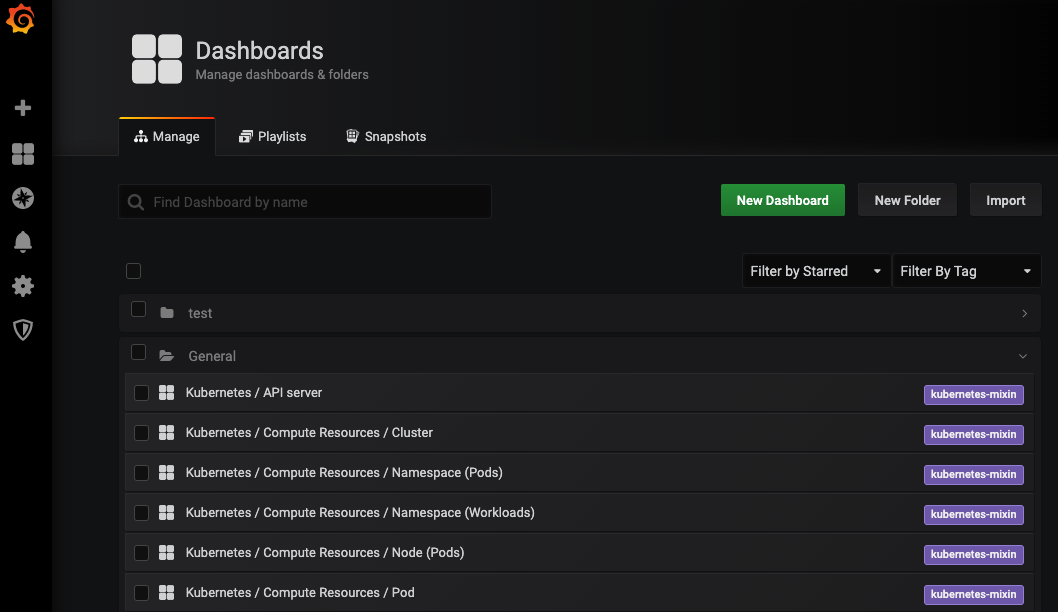
Once you are logged in, go to Dashboards and click a default dashboard or created a new one.
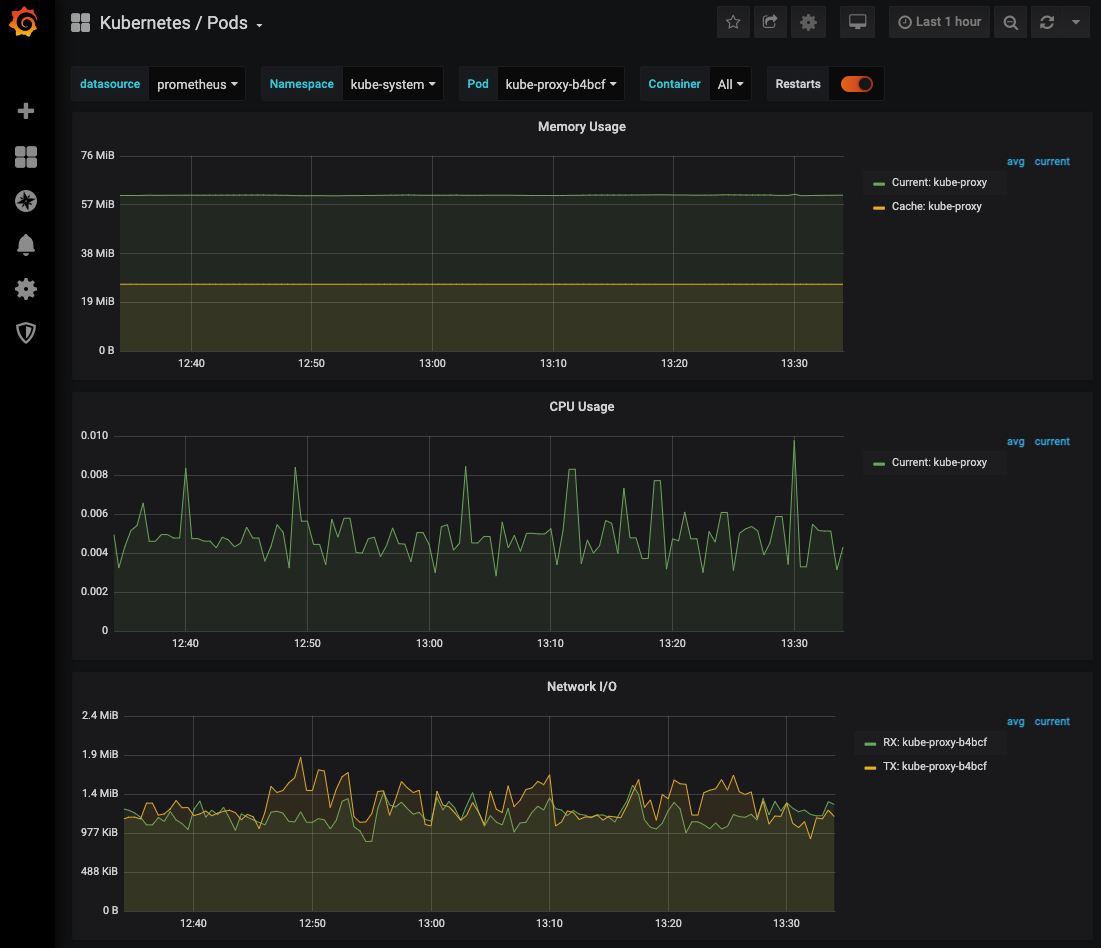
 For example, open the Kubernetes / Pods dashboard.
 See Grafana docs for information on creating dashboards.
For information on querying Prometheus, see Querying Prometheus.
Alertmanager
The Alertmanager port is listed by running kubectl get svc -n monitoring:
alertmanager-main NodePort 10.96.2.240 <none> 9093:30903/TCP
Combine that port number with the public IP for Harness Self-Managed Enterprise Edition and you have the Alertmanager endpoint. For example http://35.233.239.15:30903.
See Alerting Rules from Prometheus for details on setting up alerts.
Monitoring Harness Self-Managed Enterprise Edition - Kubernetes Cluster
Harness does not provide default monitoring for Harness Self-Managed Enterprise Edition - Kubernetes Cluster.
You can deploy a Prometheus server and Grafana to monitor Harness Self-Managed Enterprise Edition - Kubernetes Cluster. For steps on setting up monitoring using Prometheus, Grafana, and Alertmanager, see Prometheus in the KOTS docs.
If you have an existing Prometheus setup, in the KOTS admin tool you can click Configure Prometheus Address and then enter the Prometheus URL endpoint.
Availability Monitoring
The following table shows the two available URL endpoints. These are microservices with external endpoints (they have Ingress configured by default).
In these examples, <domain name> represents your vanity URL (for example, mycompany.harness.io). If your load balancer directs internal traffic for app.harness.io then the URLs can use that address.
| Service Name | Endpoint | Response |
| Verification | https://<domain name>/verification/health | {"metaData":{},"resource":"healthy","responseMessages":[]} |
| Manager | https://app.harness.io/api/health | {"status":"SUCCESS","data":"healthy","metaData":null,"correlationId":"a38c51ac-07ec-4596-b40b-4cc9487f8506"} |
The following methods can be used for monitoring other Harness Self-Managed Enterprise Edition microservices:
- MongoDB: there are many ways to monitor MongoDB instances. For example, you can monitor your MongoDB database with Grafana and Prometheus. See the article MongoDB Monitoring with Grafana & Prometheus for a summary.
- Disk/Memory: use the Kubernetes pod dashboard.