Navigate and drill down into detected vulnerabilities
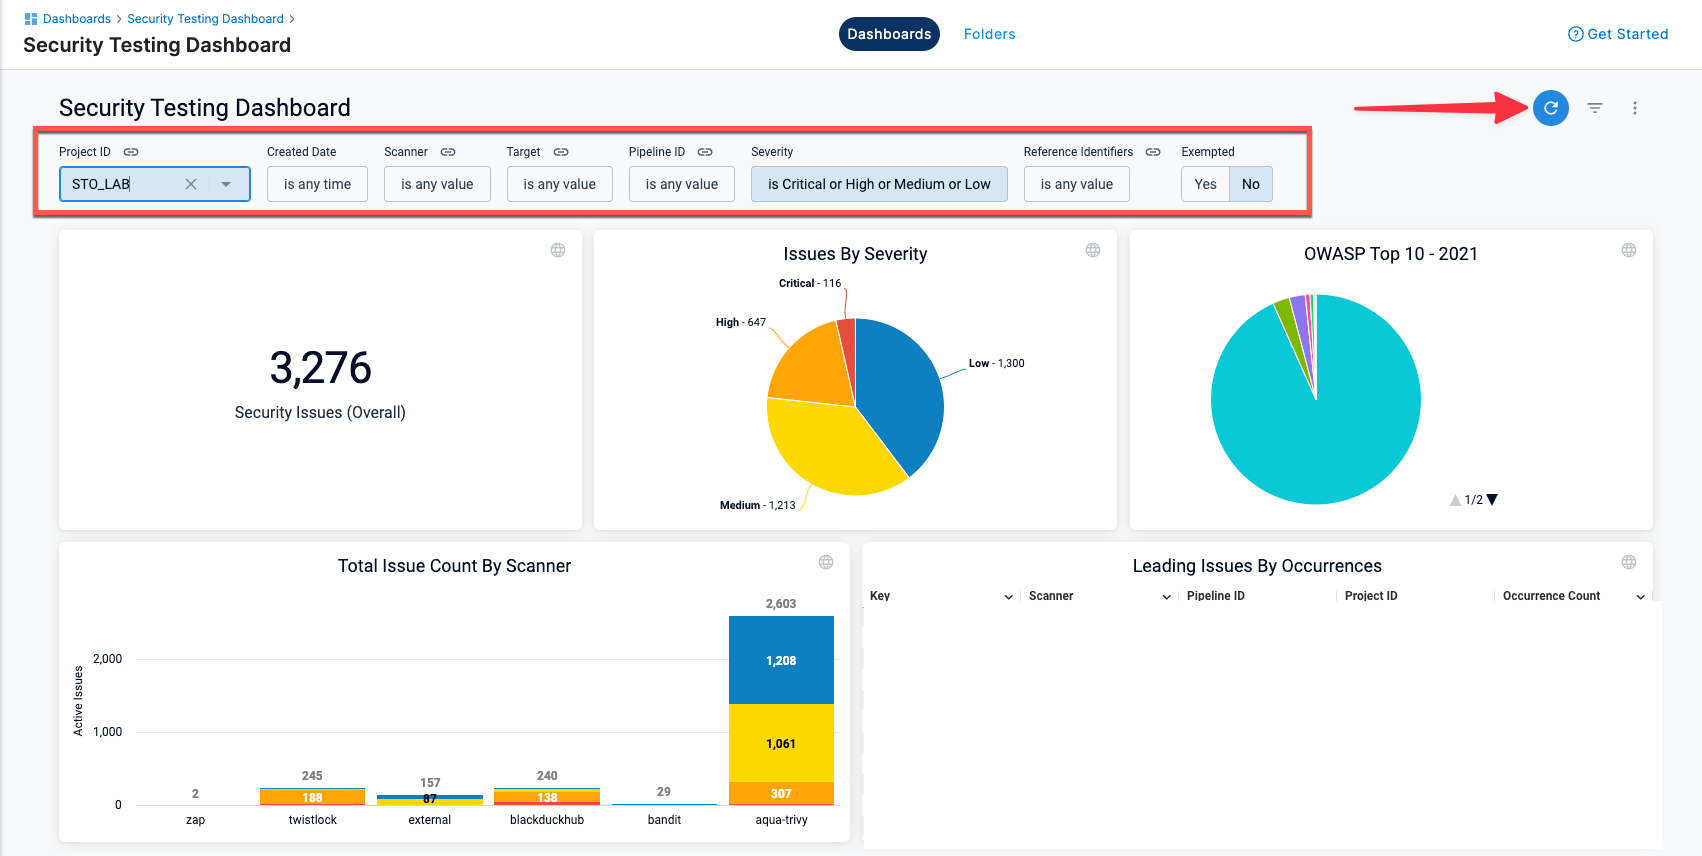
The Security Testing Dashboard enables you to view, navigate, discover and investigate detected vulnerabilities in your organization. This dashboard includes a set of filters for drilling down into specific issues by project, creation date, scanner, target, pipeline, severity, and so on. You can drill down to a set of relevant issues and then click on a pie slice, chart element, or other UI element to view details on the relevant issues.
This dashboard requires an Enterprise account.
To open the Security Testing Dashboard, select Dashboards (left menu) and then Security Testing (top checkbox).
Note the following:
This dashboard shows only results for targets that have baselines defined.
You must click Refresh (top right) to apply the filter after you configure it.
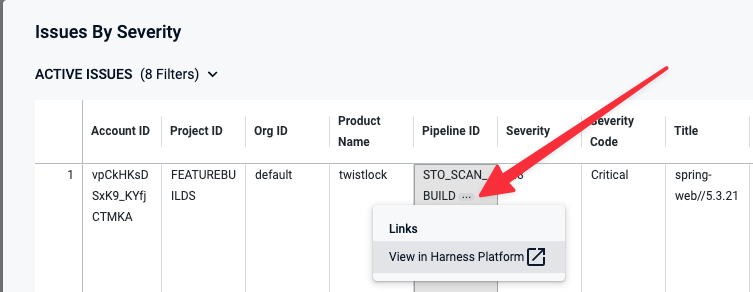
To view details for an issue from the search results, click the pipeline name or ID and choose View in Harness Platform.
The Created Date menu has several non-working options:
is null,is not null, andmatches a user attribute. This is a known issue that Harness is working to address.