Sprint metrics
Sprint metrics can help you plan and deliver on sprints more effectively, including backlog grooming and story hygiene. These metrics can help you address business problems like:
- Do teams consistently deliver on sprint plans? If not, why?
- What is the impact of creep or un-estimated tickets on plans?
- Are teams overburdened or underutilized by the sprint plans?
Sprint metrics
Sprint metrics include commit points, commit done points, commit missed points, creep points, creep done points, and delivered points.
Sprint metrics are not supported for sub-tasks.
Commit points
Commit points represents the number of story points a team planned to deliver at the beginning of the sprint. It is the sum of story points for all the tickets in the sprint backlog at the sprint start time.
For example:
- An un-estimated task at the beginning of a sprint: Adds 0 commit points.
- A task estimated as 2 story points: Adds 2 commit points.
- A task estimated as 2 points at the beginning of the sprint and later revised to 5 points during the sprint: Adds 2 commit points.
- A task estimated at 1 point is removed from the sprint while the sprint is in progress: Adds 1 commit point.
- A task estimated at 2 points is completed before the sprint start time and then added to the sprint: Adds 2 commit points and 2 commit done points.
Commit done points
Commit done is the sum of story points for all committed and completed tickets in the sprint backlog at the sprint close time.
For example:
- A completed a task estimated as 2 points: Adds 2 commit done points.
- A completed a task estimated as 3 points at the beginning of the sprint and later revised to 1 point during the sprint: Adds 1 commit done point.
- A task estimated at 1 point is removed from the sprint but still completed while the sprint was in progress: Adds 1 commit point and 1 commit done point.
Commit missed points
Commit missed points are the sum of story points for all planned, but incomplete, tasks at the sprint close time.
Creep points
Creep points are the number of points for all tickets added to the sprint after the sprint start time.
For example:
- An unestimated ticket added in the middle of the sprint: Adds 0 creep points.
- A ticket estimated at 2 points added in the middle of the sprint: Adds 2 creep points.
- A ticket estimated at 2 points added in the middle of the sprint and later revised to 5 points during the sprint: Adds 5 creep points.
Creep done points
Creep done points are the sum of story points for all creep tickets completed in the sprint. A creep ticket is a ticket added to the sprint after the sprint starts.
Delivered points
Delivered points, also called the velocity, are the sum of story points for all tasks completed within a sprint. The calculation is based on the assigned story points at the end of the sprint. It is the sum of commit done points and creep done points.
Delivered points = Commit done points + Creep done points
Sprint metrics ratios
The following ratios are calculated from sprint metrics:
Delivered to commit ratio = Delivered points / Commit pointsCommit done ratio = Commit done points / Commit pointsCommit missed ratio = MAX(0, 1 - Commit done ratioCreep to commit ratio = Creep points / Commit pointsCreep done ratio = Creep done points / Creep pointsCreep missed ratio = MAX(0, 1 - Creep done ratio)Creep done to commit ratio = Creep done points / Commit points
Sprint metrics use cases
These examples show how you can use sprint metrics to measure team performance.
Example #1: Measure team performance in recent sprints
Use the commit done ratio to check the team's performance on recent sprint plans. Compute this metric as an average over the last 2 months or 6 sprints.
If the average commit done ratio over a long period of time is above 70 percent, then the team is executing sprint plans well and could potentially take on more load. If the total done to commit ratio is above 120 percent, then the sprint plans aren't making full use of the team's capacity.
An commit done ratio below 60 percent indicates poor performance on sprint plans, and there is room for improvement in sprint delivery. There are several reasons a team might perform poorly on sprint plans. Check for:
- The impact of creep and context switching on sprint plans. Check the creep to commit ratio and the creep done to commit ratio. Creep that is consistently above 40 percent could have an impact on sprint deliverables.
- Vague requirements that cause rework and impact sprint delivery. Use an Issue Hygiene Report to check the sprint's Hygiene Score.
- If none of the above apply, then the team may be consistently planning for more than they can deliver.
Here is a flow chart illustrating the use of sprint metrics for performance analysis:

Example #2: Analyze sprint performance
This example analyzes team performance over a sprint, as represented by the following JIRA sprint report:
| Ticket ID | Points | Status | Notes |
|---|---|---|---|
| LO-1 | 2 | Done | Completed in the sprint |
| LO-2 | 1 -> 2 | Done | Points changed from 1 to 2 mid-sprint, completed in the sprint |
| LO-3 | 5 | Done | Creep, completed in the sprint |
| LO-4 | 5 | In Progress | Not completed |
| LO-5 | 1 | In Progress | Creep, not completed |
| LO-6 | 1 | Done | Completed outside the sprint |
| LO-7 | 1 | To Do | Removed from sprint |
The following table represents how the above JIRA sprint report is interpreted by SEI:
| Issue | Status | Commit points | Commit done points | Delivered points | Creep points | Creep done points |
|---|---|---|---|---|---|---|
| LO-1 | Done | 2 | 2 | 2 | - | - |
| LO-2 | Done | 1 | 2 | 2 | - | - |
| LO-3 | Done | - | - | 5 | 5 | 5 |
| LO-4 | In Progress | 5 | - | - | - | - |
| LO-5 | In Progress | - | - | - | 1 | - |
| LO-6 | Done | 1 | 1 | 1 | - | - |
| LO-7 | To Do | 1 | - | - | - | - |
| Total | - | 10 | 5 | 10 | 6 | 5 |
Using the above points values to produce sprint metrics ratios, the results of the sprint performance analysis are as follows:
| Metric | Value | Analysis |
|---|---|---|
| Commit done ratio | 5/10 = 50% | Indicates poor performance on the plan. |
| Done/Delivered to commit ratio | 10/10 = 100% | Indicates an overall good job delivering on commitments. |
| Creep to commit ratio | 6/10 = 60% | Indicates too much creep in the plan. |
| Creep done to commit ratio | 5/10 = 50% | Poor performance on the plan is explained by creep. |
Sprint metrics reports
Use sprint metrics reports to analyze sprint and planning metrics.
When configuring sprint metrics reports, the following two settings are popular for examining sprint metrics:
- Sprint End Date: Use this time range filter to limit metrics to the last few sprints. It is recommended to observe sprint metrics over 2 months or 6 sprints.
- Sprint Report: Use this field to limit the metrics to a selected sprint stream or sprint names with a common prefix.
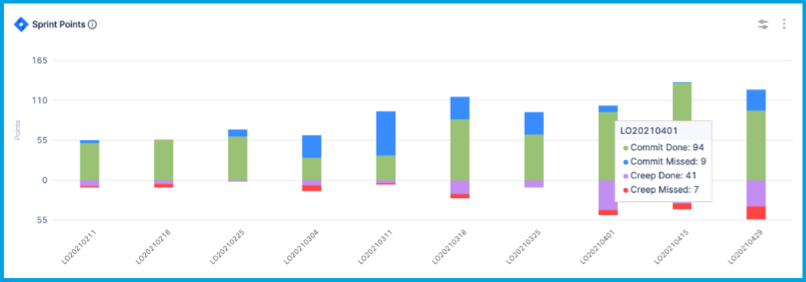
Sprint Metrics Trend Report
The Sprint Metrics Trend Report is recommended for visualizing a time series trend of sprint metrics, like commit done points, creep points, or commit points.
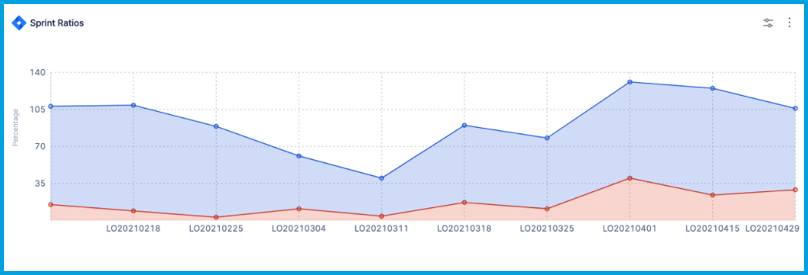
Sprint Metrics Percentage Trend Report
Use the Sprint Metrics Percentage Trend Report to examine a time series trend of selected sprint metrics ratios. This report is recommended for visualizing changes in the commit done ratio, total done to commit ratio, and creep to commit ratio.
Sprint Metrics Single Stat
Sprint Metrics Single Stat presents a single sprint metric averaged over the selected time interval.

Other reports
- Sprint Impact of Unestimated Tickets Report
- Sprint Goal Report
- Sprint Distribution Retrospective Report