Manage SLOs using Prometheus metrics
Background on Service Level Objectives
In technology, the adage that you can not improve what you can’t measure is very true. Indicators and measurements of how well a system is performing can be represented by one of the Service Level (SLx) commitments. There is a trio of metrics, SLAs, SLOs, and SLIs, that paint a picture of the agreement made vs the objectives and actuals to meet the agreement. Focusing on the SLO or Service Level objectives, those are the goals to meet in your system.
Service Level Objectives are goals that need to be met in order to meet Service Level Agreements [SLAs]. Looking at Tom Wilkie’s RED Method can help you come up with good metrics for SLOs: requests, errors, and duration. Google’s Four Golden Signals are also great metrics to have as SLOs, but also includes saturation.
For example, there might be an SLA defined by the business as “we require 99% uptime”. The SLO to make that happen would be “we need to reply in 1000 ms or less 99% of the time” to meet that agreement.
Managing and Measuring Your SLOs
Drawing a conclusion can always be tricky especially if data is coming from different sources and services. If you had one and only one service in your organization, the amount of system and business knowledge about this one service would be easy to disseminate. Though that is not the case for any organization as the number of services increase and domain expertise does not stay within a singular individual.
A myth about SLOs is that they are static in nature. As technology, capabilities, and features change, SLOs need to adapt with them. In an age of dial up internet, the example SLO of “we need to reply in 1000ms or less 99% of the time” would be impossible. As cloud infrastructure and internet speeds increased over the decades, that SLO seems very possible.
SLIs are used to measure your SLOs. SLO Management would not be possible without including the SLIs. In the response example, the SLI would be an actual response time which the SLO tracks against. In the below example, we will be setting up an SLO and SLI.
Getting Started with SLO Management
Harness provides a module called Service Reliability Management to help with your SLO Management, if you have not already, request a Harness SRM Account. Once signed up, the next step to on-ramp you to the Harness Platform is to install a Harness Delegate.
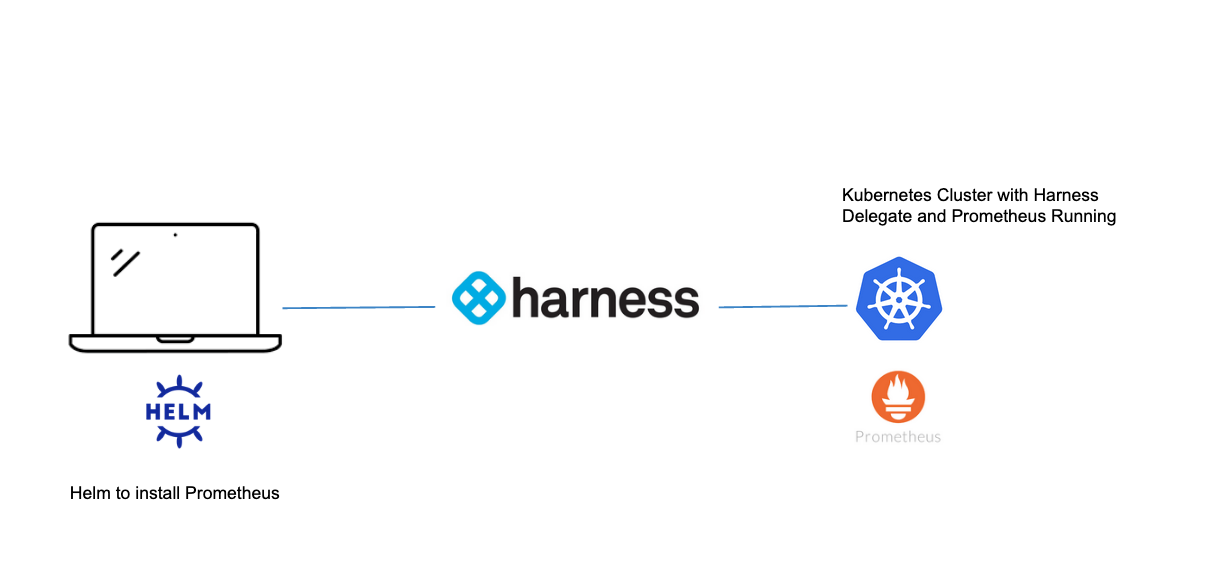
In this example, will use Prometheus, an open source monitoring solution, to intercept metrics from an example application. The Open Observability Group has an example application which can be deployed to Kubernetes that writes to Prometheus metrics.
Install Prometheus
An easy way to install Prometheus on your Kubernetes cluster is to use Helm.
helm repo add prometheus-community https://prometheus-community.github.io/helm-charts

helm repo update

helm upgrade --install prometheus prometheus-community/prometheus \
--namespace prometheus --create-namespace
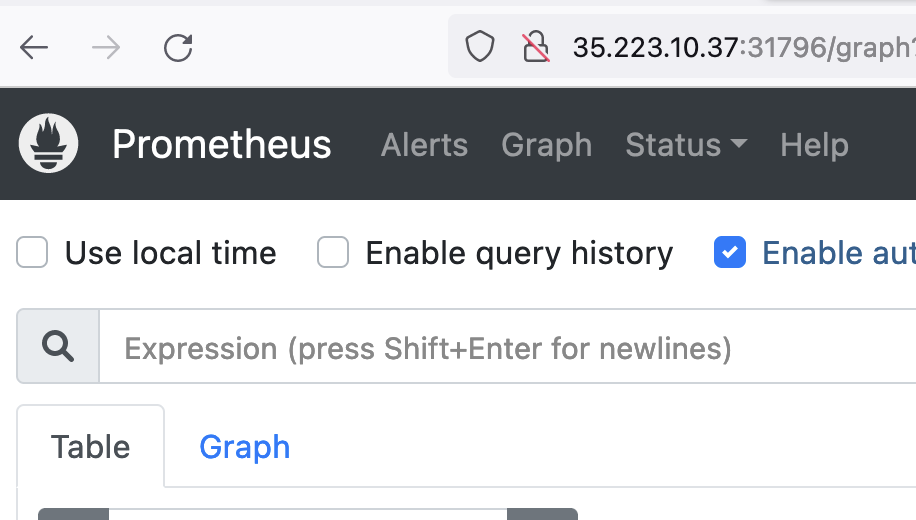
Once installed, there are a few ways to access your Prometheus Web UI. It is not recommended with workloads of substance to expose this to the public. For this example, can expose via NodePort.
kubectl expose deployment -n prometheus prometheus-server --type=NodePort --name=prometheus-service
With a NodePort, you access the Service deployed on the cluster via your browser with node_public_ip:nodeport.
You can find your a Kubernetes node’s public IP by running:
kubectl get nodes -o wide

Then can grab the NodePort.
kubectl get svc -n prometheus
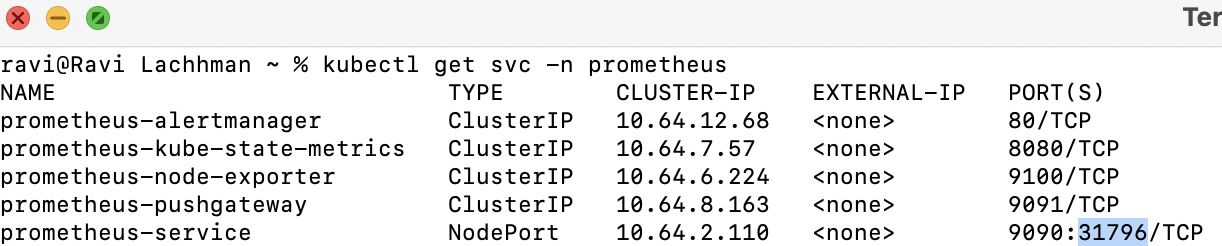
In this case, the node_ip:nodeport combo is http://35.223.10.37:31796.
Note: If you are using a cloud rendition of Kubernetes e.g. EKS/GKE/AKS, by default your firewall might not allow for TCP traffic over NodePort range. Can open up specifically for each NodePort or give a range to cover all NodePorts; TCP ports 30000-32768.
Now you are ready to deploy an application that writes to Prometheus.
Deploying an Application That Writes to Prometheus
Following the Open Observability Group’s Sample Application, you can build from source or use an already built rendition that we have built.
Kubectl apply -f https://raw.githubusercontent.com/harness-apps/developer-hub-apps/main/applications/prometheus-sample-app/prometheus-sample-app-k8s-deployment.yaml

With the application installed, now you can explore some metrics with Prometheus then wire those metrics to Harness.
Prometheus Metrics
Prometheus groups metrics in several ways. There are four metric primitive types that Prometheus supports. Querying these metrics are handled by Prometheus’s query language, or PromQL.
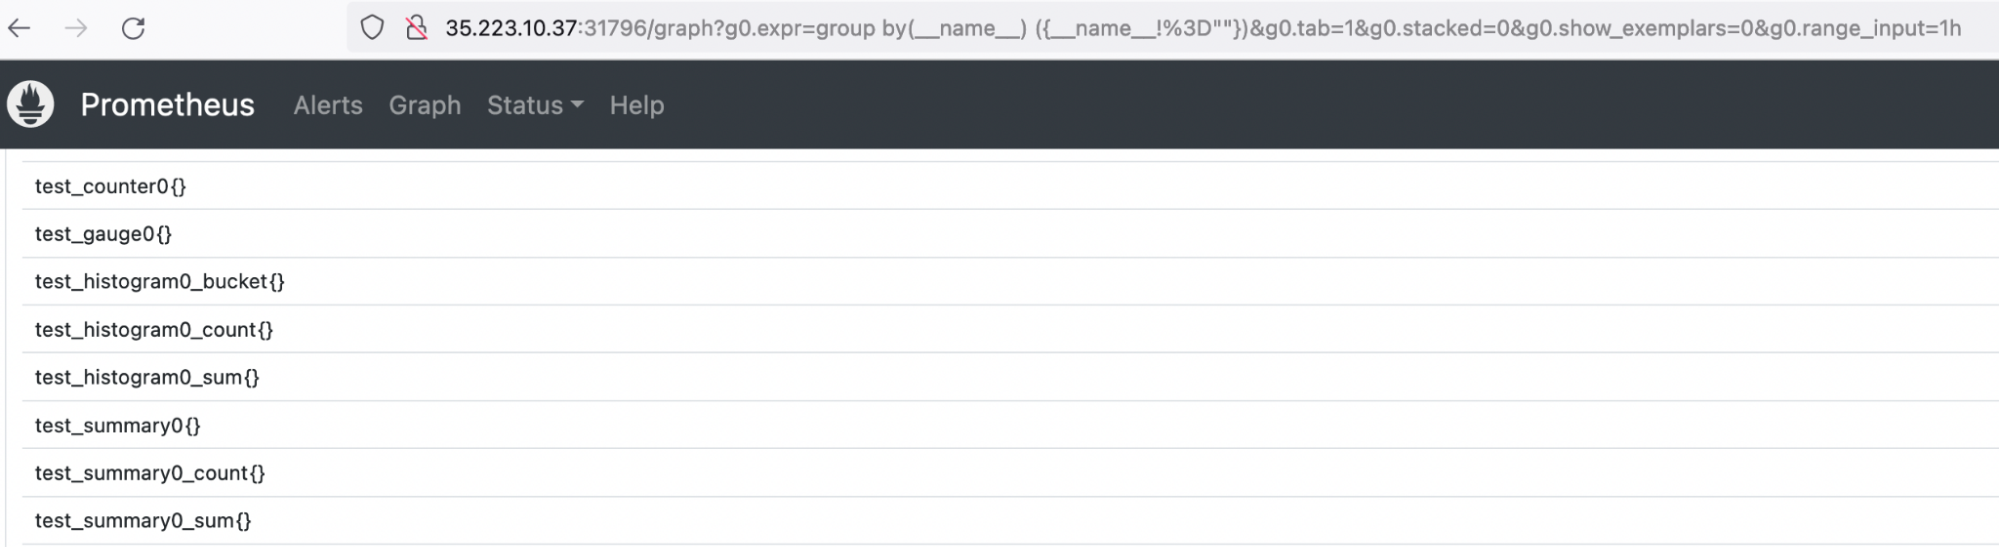
If this is your first time delving into Prometheus or just want to find out more about what your applications are sending in, this Prometheus Blog is a good resource to explore your metrics when the metric names are unknown. Below is a PromQL query to list all available metrics in your Prometheus instance.
group by(__name__) ({__name__!=""})
Running that query, will notice all four metric types are being written by the example application.
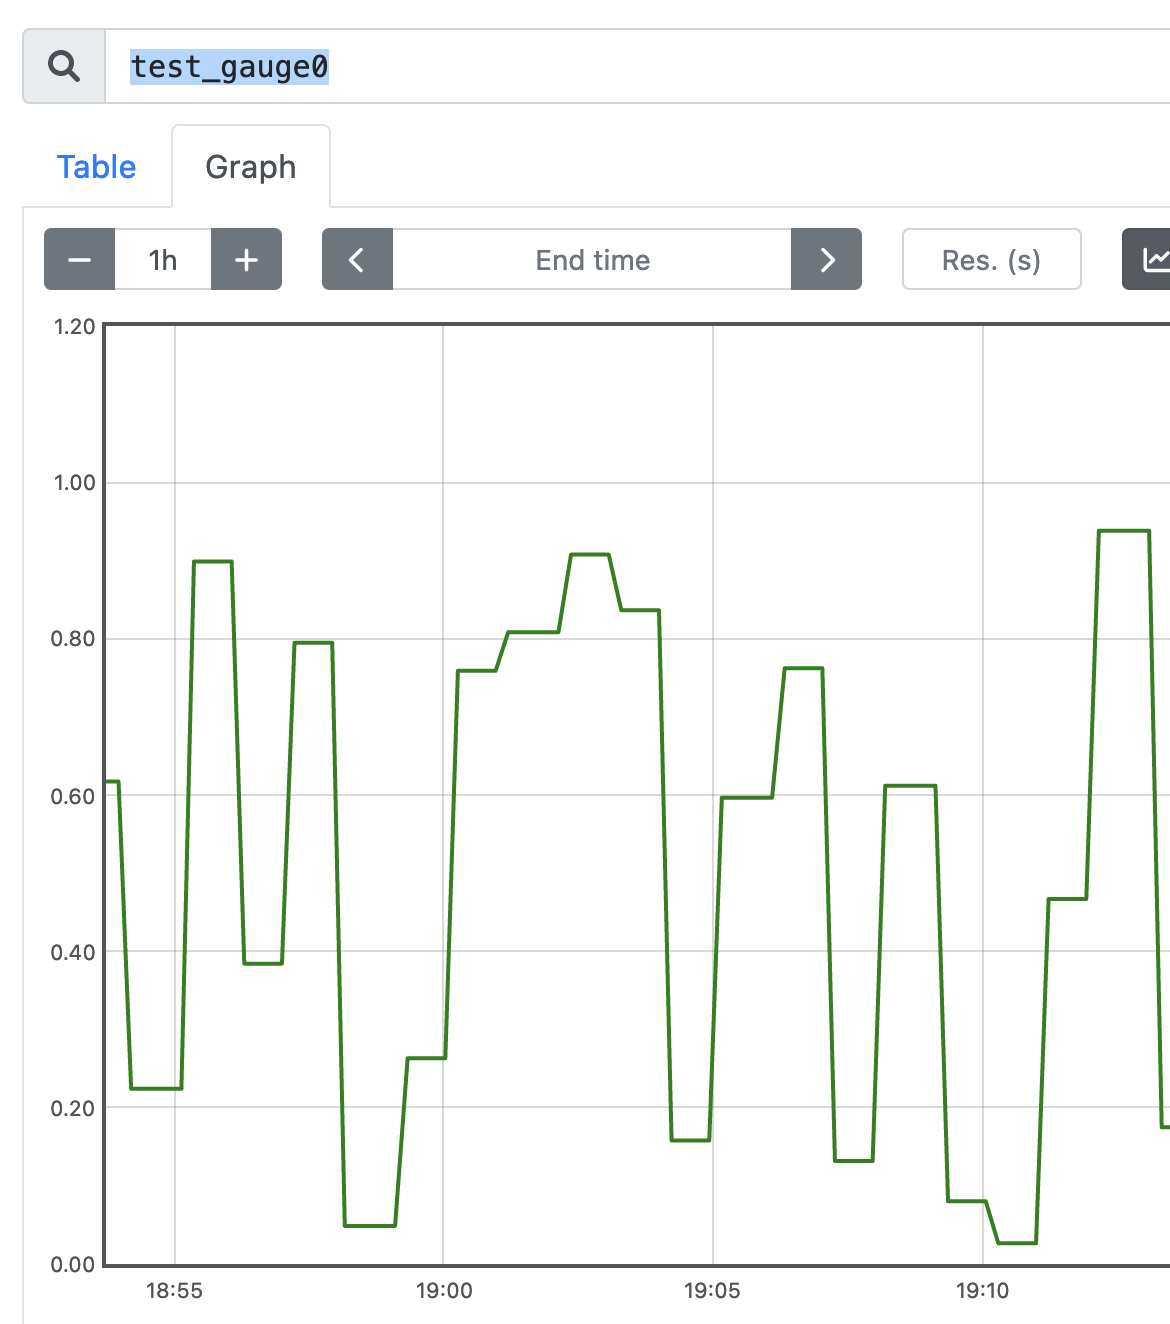
The test_gauge0 metric is a good metric to take a look at. A Gauge in Prometheus is a metric that represents a singular numerical value. How the sample application is designed will increase and decrease the gauge counter over time, which if this was a real life gauge could represent something like memory pressure or response time.
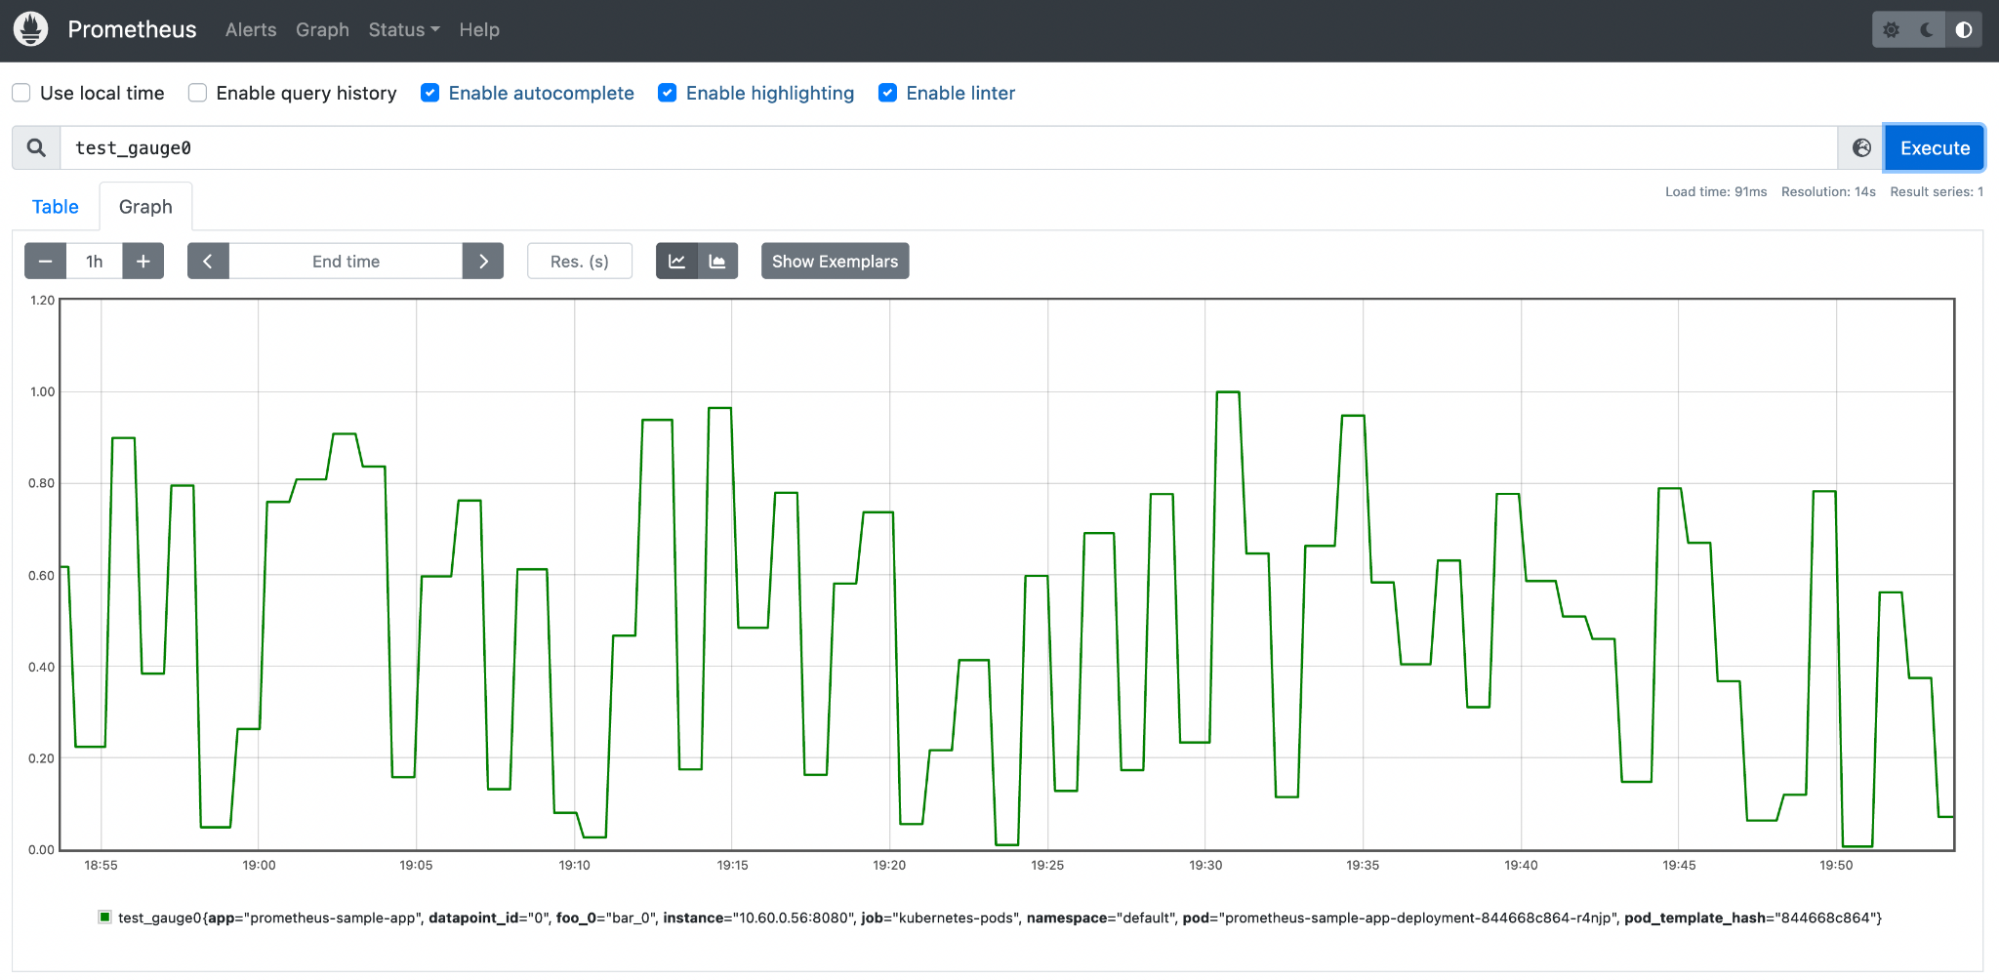
With this metric, you are now able to start to manage this metric.
Getting Started With Your First SLO
Configure your service metrics/telemetry as SLOs to Harness SRM has a few Harness Objects to be created. If you have not already, request to sign up for a Harness SRM Account. If this is your first time leveraging Harness, Harness has a concept of Projects. The Default Project is more than adequate to wire in your first SLO.
Install Delegate
You will also need to wire in a Kubernetes Delegate if you have not done so already.
Install Delegate
Install Harness Delegate on Kubernetes or Docker
What is Harness Delegate?
Harness Delegate is a lightweight worker process that is installed on your infrastructure and communicates only via outbound HTTP/HTTPS to the Harness Platform. This enables the Harness Platform to leverage the delegate to execute the CI/CD and other tasks on your behalf, without any of your secrets leaving your network.
You can install the Harness Delegate on either Docker or Kubernetes.
Install Harness Delegate
Create a new delegate token
Log in to the Harness Platform and go to Account Settings -> Account Resources -> Delegates. Select the Tokens tab. Select +New Token, and enter a token name, for example firstdeltoken. Select Apply. Harness Platform generates a new token for you. Select Copy to copy and store the token in a temporary file. You will provide this token as an input parameter in the next installation step. The delegate will use this token to authenticate with the Harness Platform.
Get your Harness account ID
Along with the delegate token, you will also need to provide your Harness accountId as an input parameter during delegate installation. This accountId is present in every Harness URL. For example, in the following URL:
https://app.harness.io/ng/#/account/6_vVHzo9Qeu9fXvj-AcQCb/settings/overview
6_vVHzo9Qeu9fXvj-AcQCb is the accountId.
Now you are ready to install the delegate on either Docker or Kubernetes.
- Kubernetes
- Docker
Prerequisite
Ensure that you have access to a Kubernetes cluster. For the purposes of this tutorial, we will use minikube.
Install minikube
- On Windows:
choco install minikube
- On macOS:
brew install minikube
Now start minikube with the following config.
minikube start --memory 4g --cpus 4
Validate that you have kubectl access to your cluster.
kubectl get pods -A
Now that you have access to a Kubernetes cluster, you can install the delegate using any of the options below.
- Helm Chart
- Terraform Helm Provider
- Kubernetes Manifest
Install the Helm chart
As a prerequisite, you must have Helm v3 installed on the machine from which you connect to your Kubernetes cluster.
You can now install the delegate using the delegate Helm chart. First, add the harness-delegate Helm chart repo to your local Helm registry.
helm repo add harness-delegate https://app.harness.io/storage/harness-download/delegate-helm-chart/
helm repo update
helm search repo harness-delegate
We will use the harness-delegate/harness-delegate-ng chart in this tutorial.
NAME                                    CHART VERSION   APP VERSION DESCRIPTION
harness-delegate/harness-delegate-ng    1.0.8           1.16.0      A Helm chart for deploying harness-delegate
Now we are ready to install the delegate. The following example installs/upgrades firstk8sdel delegate (which is a Kubernetes workload) in the harness-delegate-ng namespace using the harness-delegate/harness-delegate-ng Helm chart.
To install the delegate, do the following:
In Harness, select Deployments, then select your project.
Select Delegates under Project Setup.
Select Install a Delegate to open the New Delegate dialog.
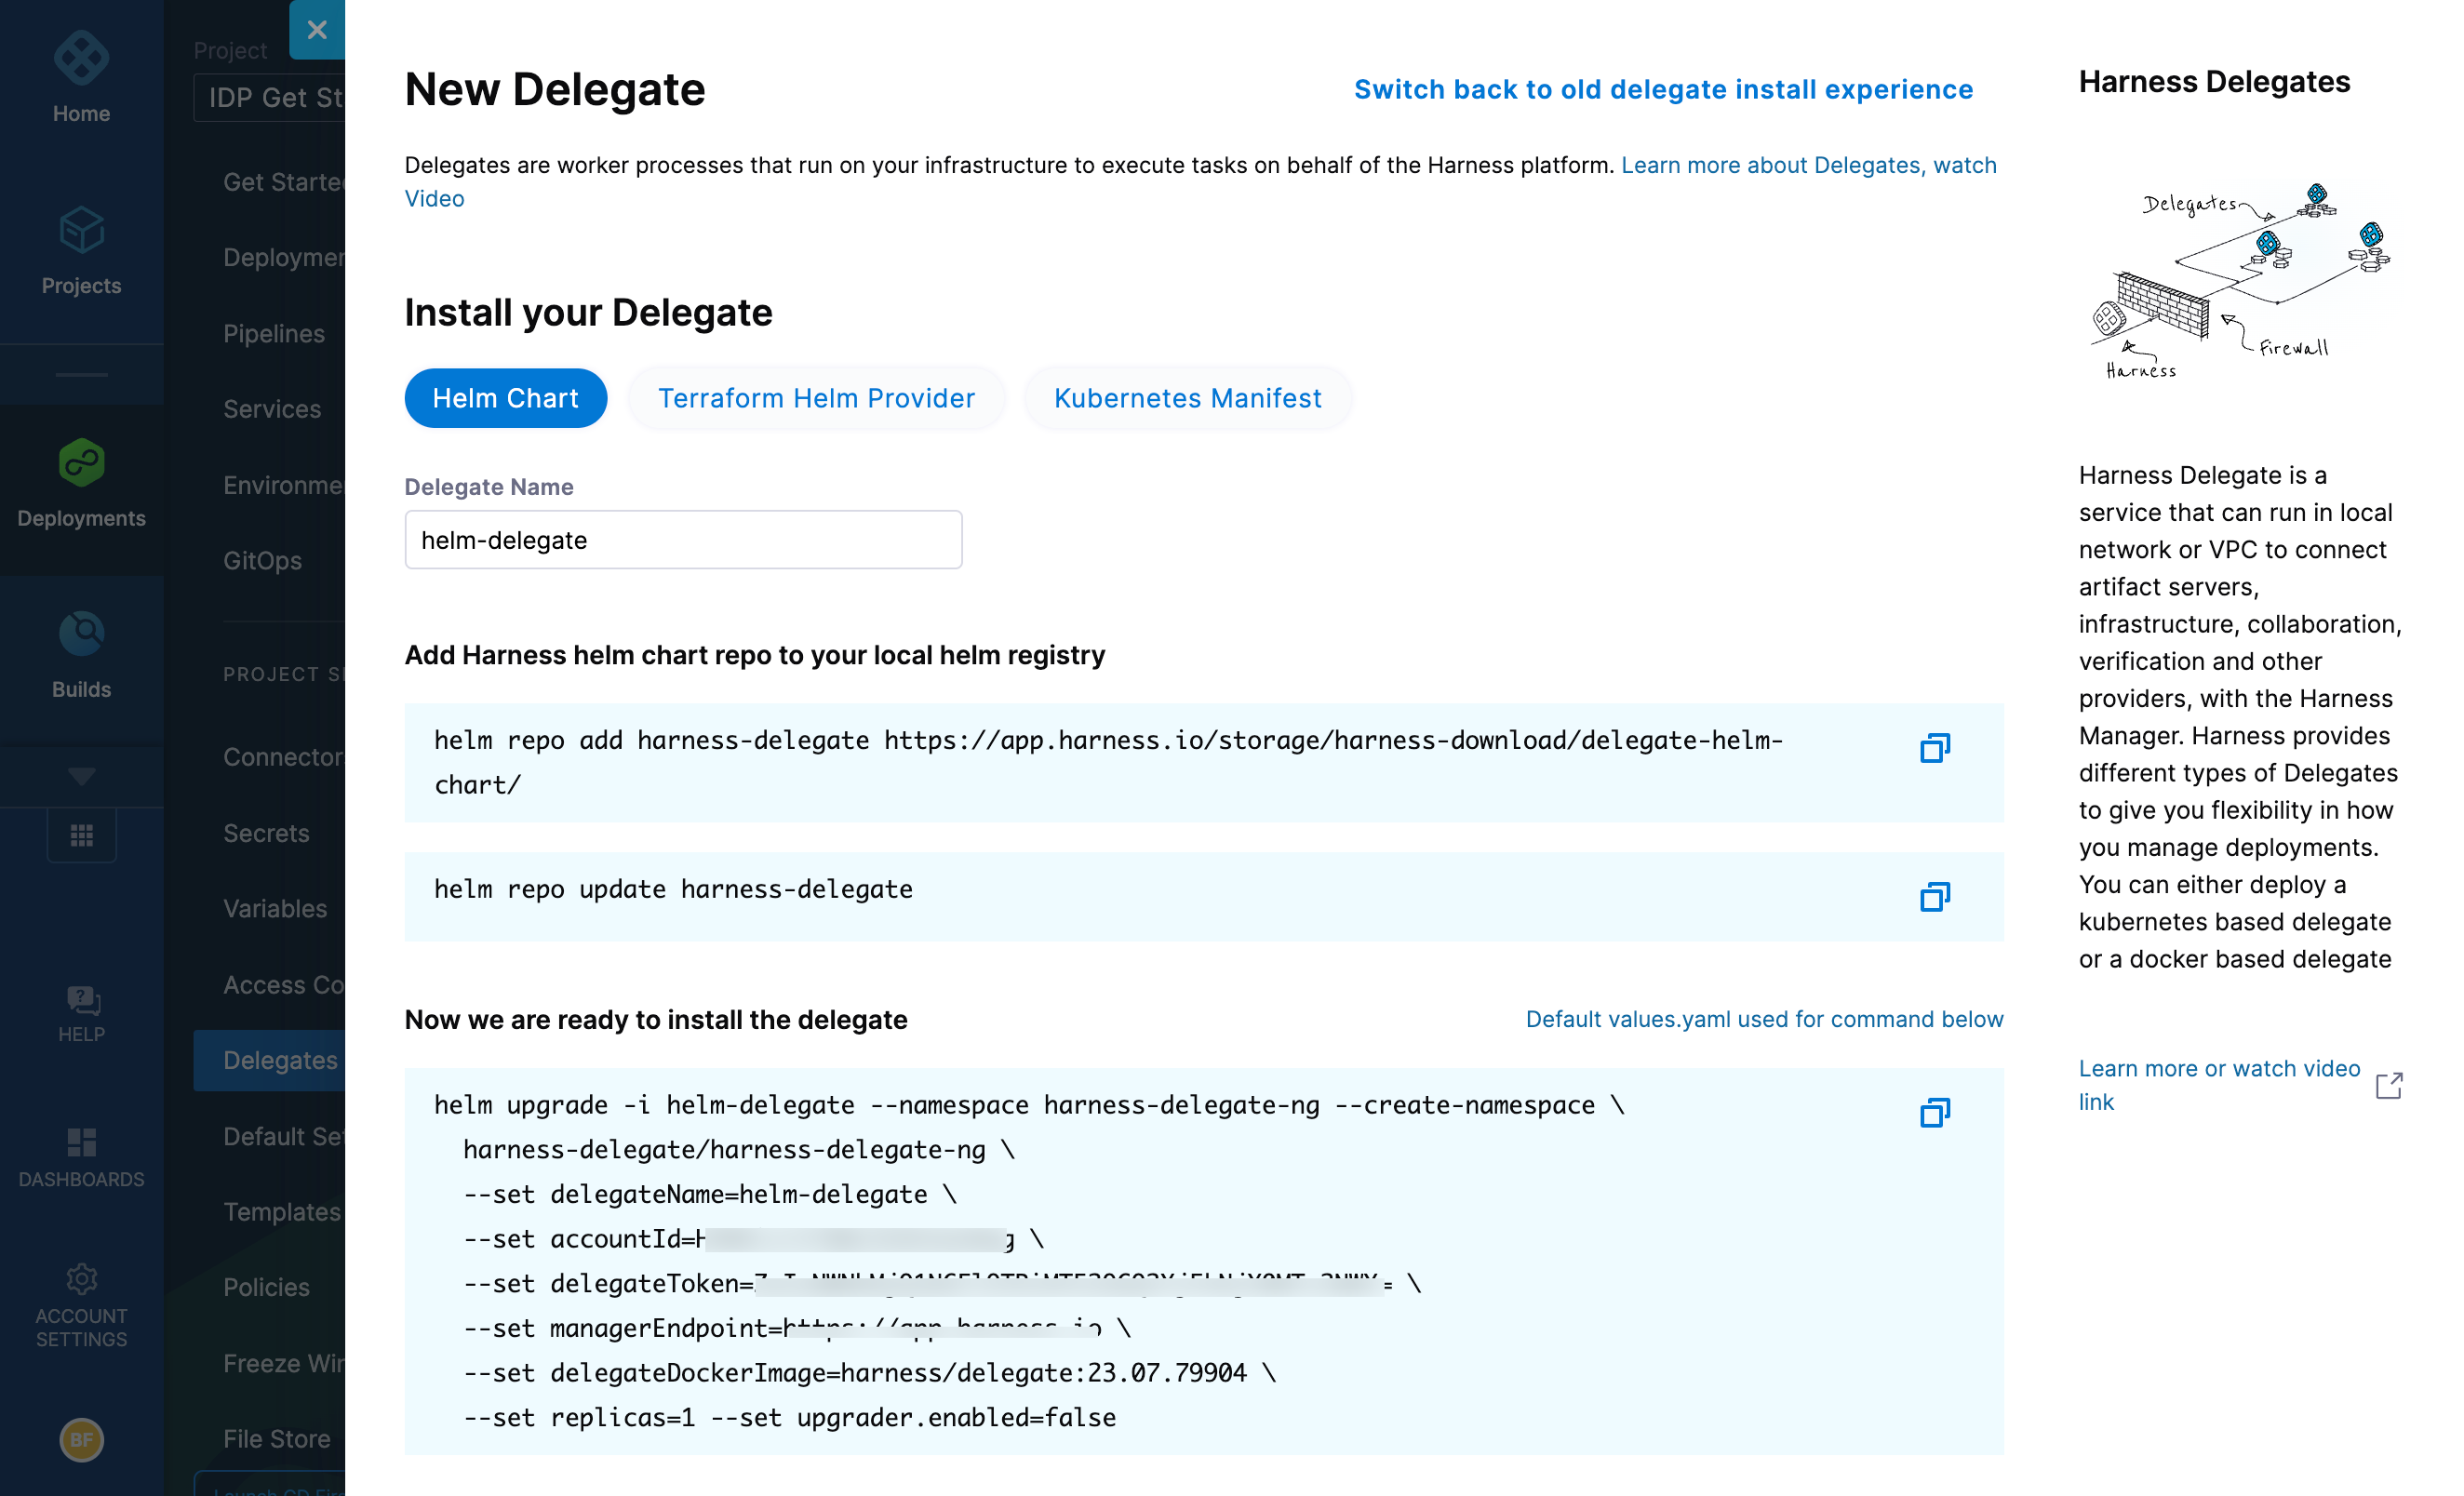
Select Helm Chart under Install your Delegate.
Copy the
helm upgradecommand.Run the command.
The command uses the default values.yaml located in the delegate-helm-chart GitHub repo. If you want change one or more values in a persistent manner instead of the command line, you can download and update the values.yaml file as per your need. You can use the updated values.yaml file as shown below.
helm upgrade -i firstk8sdel --namespace harness-delegate-ng --create-namespace \
  harness-delegate/harness-delegate-ng \
  -f values.yaml \
  --set delegateName=firstk8sdel \
  --set accountId=PUT_YOUR_HARNESS_ACCOUNTID_HERE \
  --set delegateToken=PUT_YOUR_DELEGATE_TOKEN_HERE \
  --set managerEndpoint=PUT_YOUR_MANAGER_HOST_AND_PORT_HERE \
  --set delegateDockerImage=harness/delegate:23.02.78306 \
  --set replicas=1 --set upgrader.enabled=false
Create main.tf file
Harness uses a Terraform module for the Kubernetes delegate. This module uses the standard Terraform Helm provider to install the Helm chart onto a Kubernetes cluster whose config by default is stored in the same machine at the ~/.kube/config path. Copy the following into a main.tf file stored on a machine from which you want to install your delegate.
module "delegate" {
  source = "harness/harness-delegate/kubernetes"
  version = "0.1.5"

  account_id = "PUT_YOUR_HARNESS_ACCOUNTID_HERE"
  delegate_token = "PUT_YOUR_DELEGATE_TOKEN_HERE"
  delegate_name = "firstk8sdel"
  namespace = "harness-delegate-ng"
  manager_endpoint = "PUT_YOUR_MANAGER_HOST_AND_PORT_HERE"
  delegate_image = "harness/delegate:23.02.78306"
  replicas = 1
  upgrader_enabled = false

  # Additional optional values to pass to the helm chart
  values = yamlencode({
    javaOpts: "-Xms64M"
  })
}

provider "helm" {
  kubernetes {
    config_path = "~/.kube/config"
  }
}
Now replace the variables in the file with your Harness accound ID and delegate token values. Replace PUT_YOUR_MANAGER_HOST_AND_PORT_HERE with the Harness Manager Endpoint noted below. For Harness SaaS accounts, you can find your Harness Cluster Location on the Account Overview page under the Account Settings section of the left navigation. For Harness CDCE, the endpoint varies based on the Docker vs. Helm installation options.
| Harness Cluster Location | Harness Manager Endpoint on Harness Cluster |
|---|---|
| SaaS prod-1 | https://app.harness.io |
| SaaS prod-2 | https://app.harness.io/gratis |
| SaaS prod-3 | https://app3.harness.io |
| CDCE Docker | http://<HARNESS_HOST> if Docker Delegate is remote to CDCE or http://host.docker.internal if Docker Delegate is on same host as CDCE |
| CDCE Helm | http://<HARNESS_HOST>:7143 where HARNESS_HOST is the public IP of the Kubernetes node where CDCE Helm is running |
Run Terraform init, plan, and apply
Initialize Terraform. This downloads the Terraform Helm provider to your machine.
terraform init
Run the following step to view the changes Terraform is going to make on your behalf.
terraform plan
Finally, run this step to make Terraform install the Kubernetes delegate using the Helm provider.
terraform apply
When prompted by Terraform if you want to continue with the apply step, type yes, and then you will see output similar to the following.
helm_release.delegate: Creating...
helm_release.delegate: Still creating... [10s elapsed]
helm_release.delegate: Still creating... [20s elapsed]
helm_release.delegate: Still creating... [30s elapsed]
helm_release.delegate: Still creating... [40s elapsed]
helm_release.delegate: Still creating... [50s elapsed]
helm_release.delegate: Still creating... [1m0s elapsed]
helm_release.delegate: Creation complete after 1m0s [id=firstk8sdel]

Apply complete! Resources: 1 added, 0 changed, 0 destroyed.
Download a Kubernetes manifest template
curl -LO https://raw.githubusercontent.com/harness/delegate-kubernetes-manifest/main/harness-delegate.yaml
Replace variables in the template
Open the harness-delegate.yaml file in a text editor and replace PUT_YOUR_DELEGATE_NAME_HERE, PUT_YOUR_HARNESS_ACCOUNTID_HERE, and PUT_YOUR_DELEGATE_TOKEN_HERE with your delegate name (for example, firstk8sdel), Harness accountId, and delegate token values, respectively.
Replace the PUT_YOUR_MANAGER_HOST_AND_PORT_HERE variable with the Harness Manager Endpoint noted below. For Harness SaaS accounts, you can find your Harness Cluster Location on the Account Overview page under the Account Settings section of the left navigation. For Harness CDCE, the endpoint varies based on the Docker vs. Helm installation options.
| Harness Cluster Location | Harness Manager Endpoint on Harness Cluster |
|---|---|
| SaaS prod-1 | https://app.harness.io |
| SaaS prod-2 | https://app.harness.io/gratis |
| SaaS prod-3 | https://app3.harness.io |
| CDCE Docker | http://<HARNESS_HOST> if Docker Delegate is remote to CDCE or http://host.docker.internal if Docker Delegate is on same host as CDCE |
| CDCE Helm | http://<HARNESS_HOST>:7143 where HARNESS_HOST is the public IP of the Kubernetes node where CDCE Helm is running |
Apply the Kubernetes manifest
kubectl apply -f harness-delegate.yaml
Prerequisite
Ensure that you have the Docker runtime installed on your host. If not, use one of the following options to install Docker:
Install on Docker
Now you can install the delegate using the following command.
docker run --cpus=1 --memory=2g \
  -e DELEGATE_NAME=docker-delegate \
  -e NEXT_GEN="true" \
  -e DELEGATE_TYPE="DOCKER" \
  -e ACCOUNT_ID=PUT_YOUR_HARNESS_ACCOUNTID_HERE \
  -e DELEGATE_TOKEN=PUT_YOUR_DELEGATE_TOKEN_HERE \
  -e LOG_STREAMING_SERVICE_URL=PUT_YOUR_MANAGER_HOST_AND_PORT_HERE/log-service/ \
  -e MANAGER_HOST_AND_PORT=PUT_YOUR_MANAGER_HOST_AND_PORT_HERE \
  harness/delegate:23.03.78904
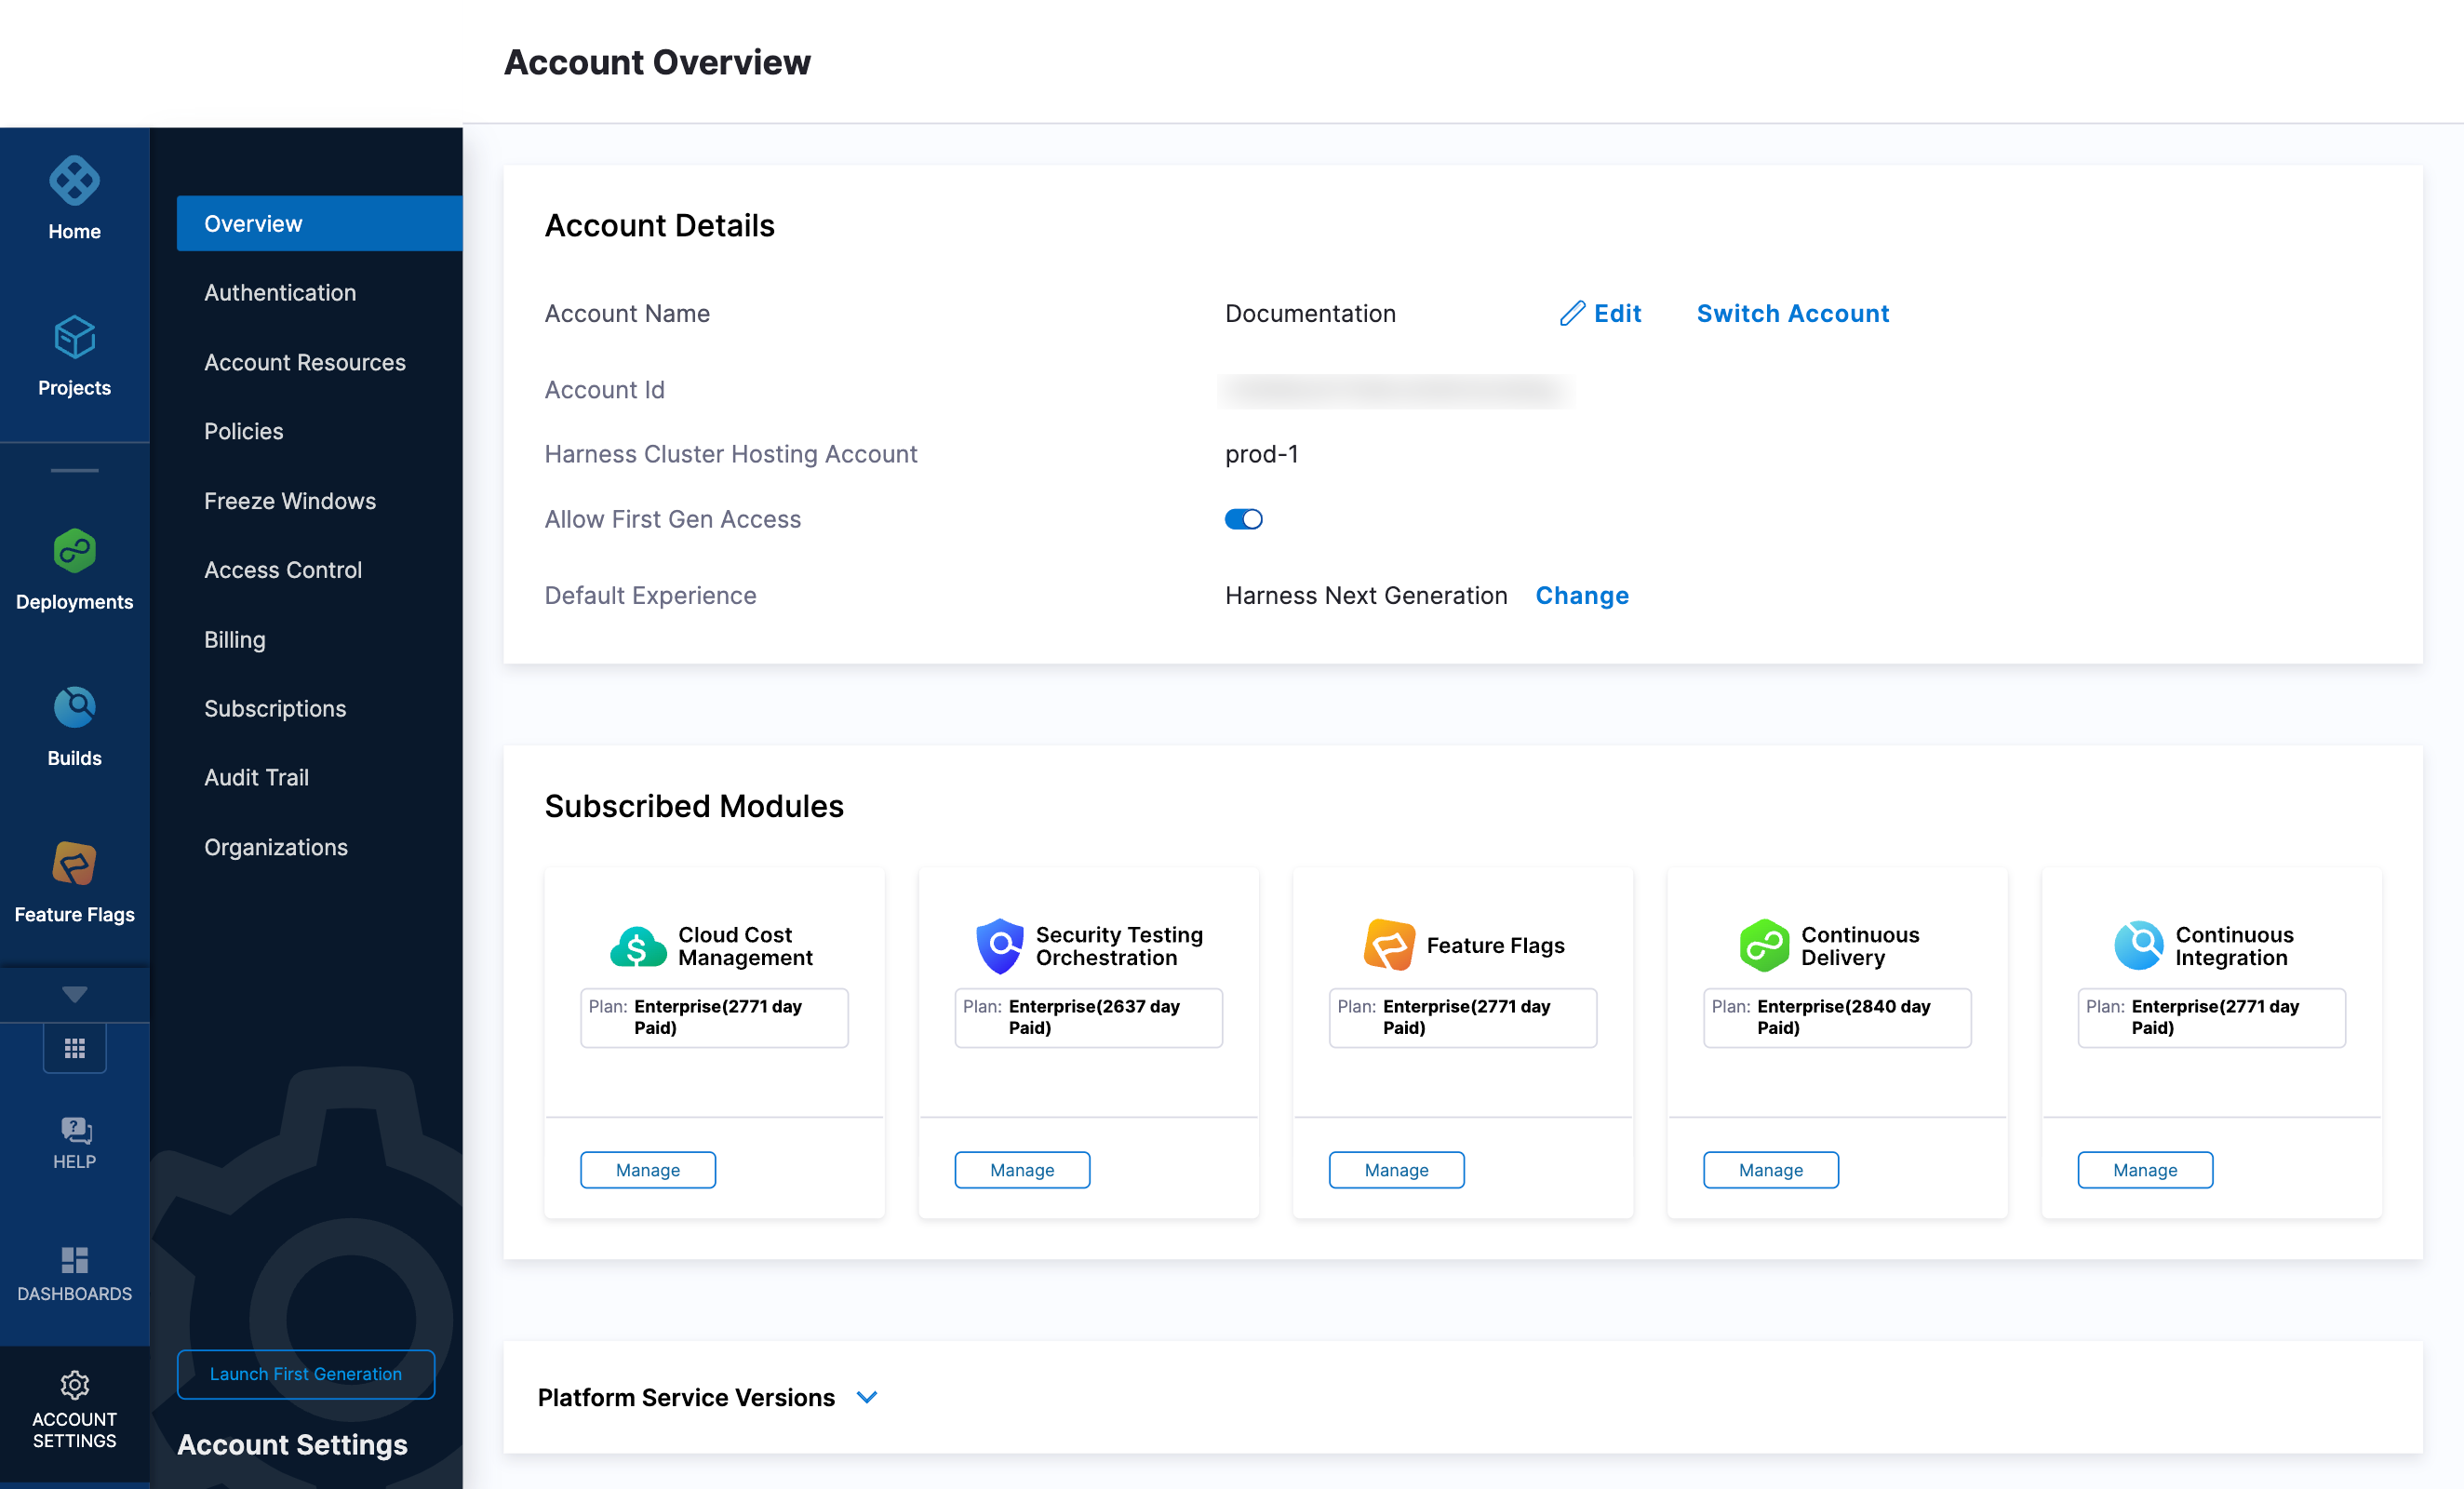
Replace the PUT_YOUR_MANAGER_HOST_AND_PORT_HERE variable with the Harness Manager Endpoint noted below. For Harness SaaS accounts, to find your Harness cluster location, select Account Settings, and then select Overview. In Account Overview, look in Account Settings. It is listed next to Harness Cluster Hosting Account.
For more information, go to View account info and subscribe to downtime alerts.
For Harness CDCE, the endpoint varies based on the Docker vs. Helm installation options.
| Harness Cluster Location | Harness Manager Endpoint on Harness Cluster |
|---|---|
| SaaS prod-1 | https://app.harness.io |
| SaaS prod-2 | https://app.harness.io/gratis |
| SaaS prod-3 | https://app3.harness.io |
| CDCE Docker | http://<HARNESS_HOST> if Docker Delegate is remote to CDCE or http://host.docker.internal if Docker Delegate is on same host as CDCE |
| CDCE Helm | http://<HARNESS_HOST>:7143 where HARNESS_HOST is the public IP of the Kubernetes node where CDCE Helm is running |
If you are using a local runner CI build infrastructure, modify the delegate install command as explained in Use local runner build infrastructure
Verify delegate connectivity
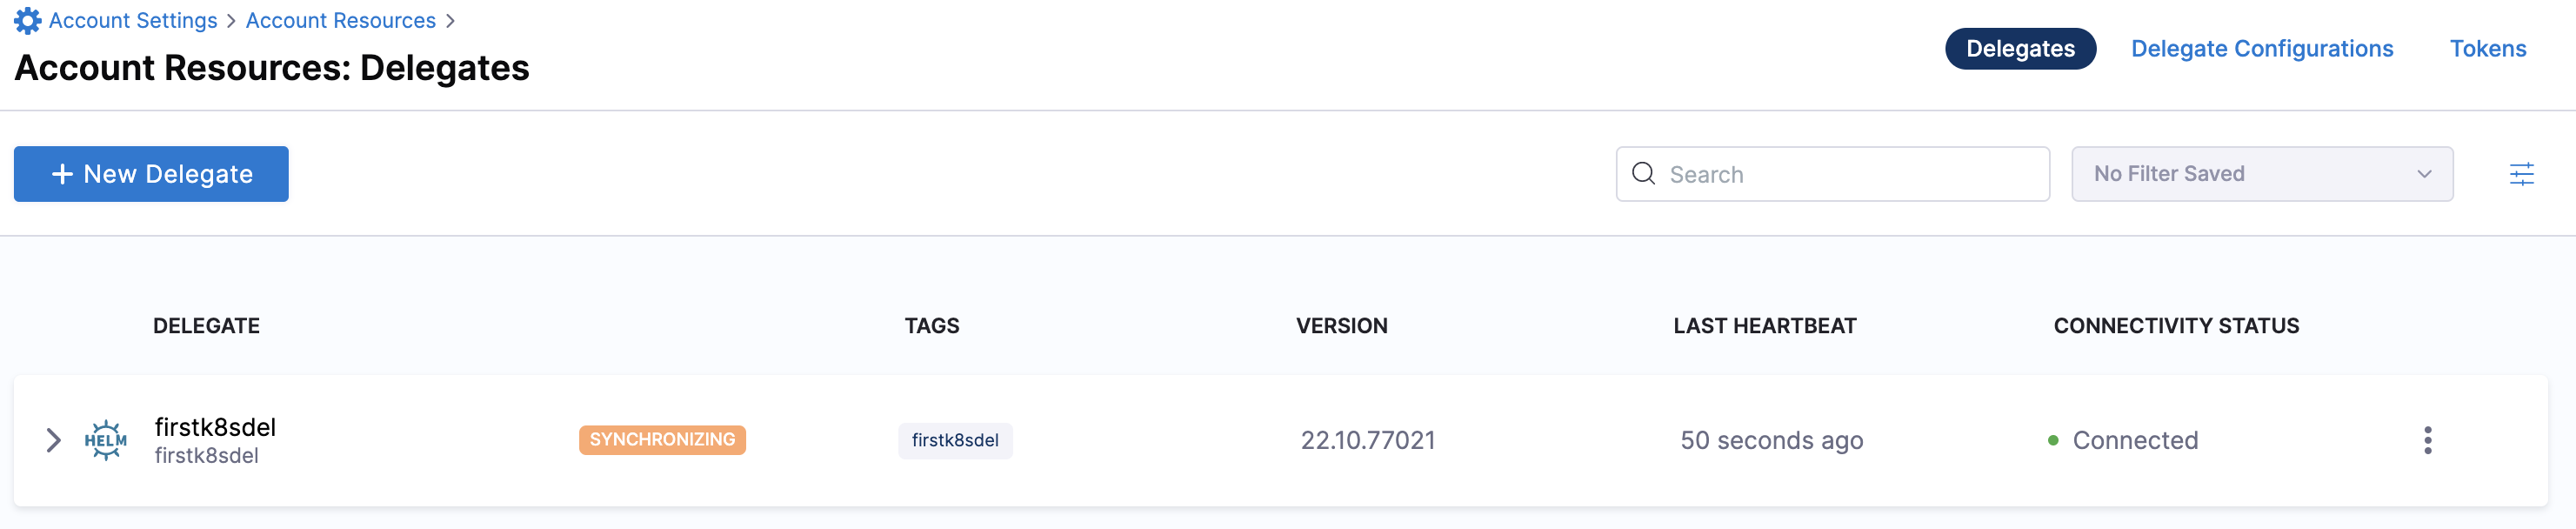
Select Continue. After the health checks pass, your delegate is available for you to use. Select Done and verify your new delegate is listed.
Helm chart & Terraform Helm provider
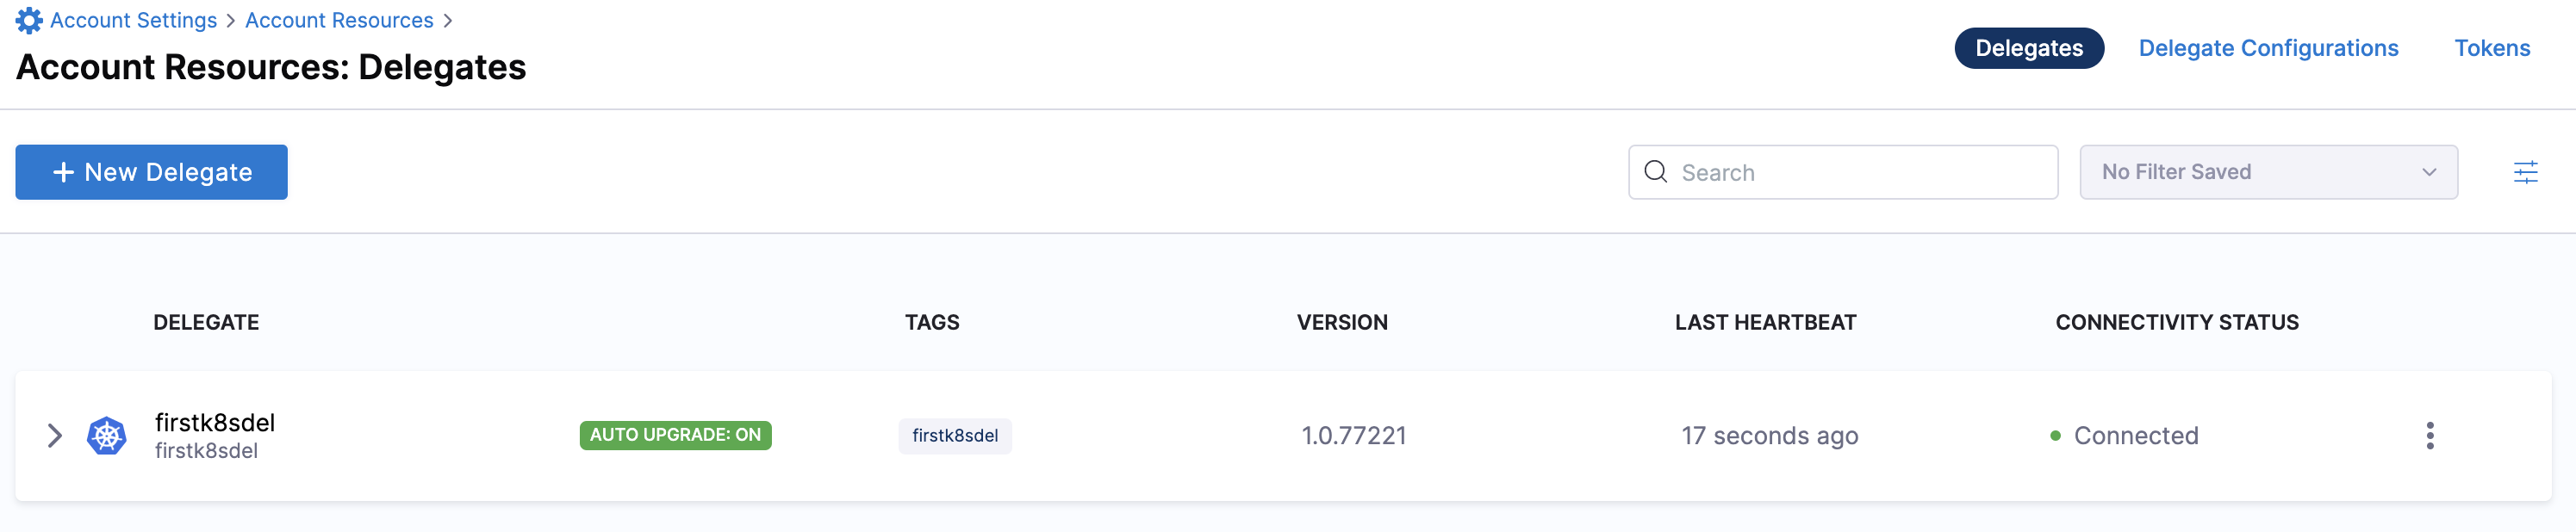
Kubernetes manifest
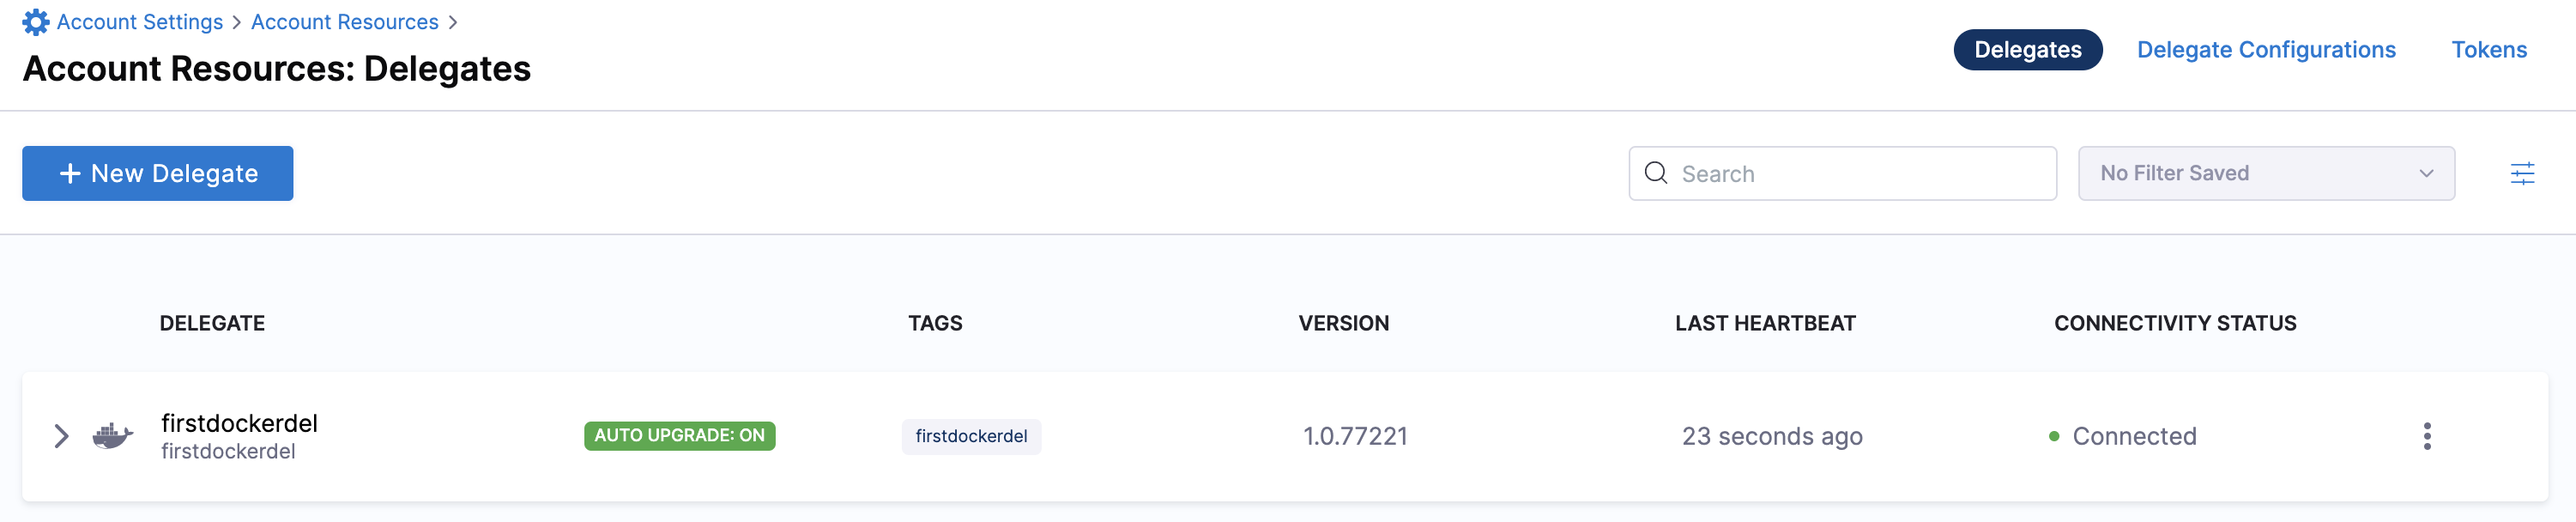
Docker
You can now route communication to external systems in Harness connectors and pipelines by selecting this delegate via a delegate selector.
Delegate selectors do not override service infrastructure connectors. Delegate selectors only determine the delegate that executes the operations of your pipeline.
Troubleshooting
The delegate installer provides troubleshooting information for each installation process. If the delegate cannot be verified, select Troubleshoot for steps you can use to resolve the problem. This section includes the same information.
Harness asks for feedback after the troubleshooting steps. You are asked, Did the delegate come up?
If the steps did not resolve the problem, select No, and use the form to describe the issue. You'll also find links to Harness Support and to Delegate docs.
- Helm Chart
- Terraform Helm Provider
- Kubernetes Manifest
- Docker
Use the following steps to troubleshoot your installation of the delegate using Helm.
Verify that Helm is correctly installed:
Check for Helm:
helmAnd then check for the installed version of Helm:
helm versionIf you receive the message
Error: rendered manifests contain a resource that already exists..., delete the existing namespace, and retry the Helm upgrade command to deploy the delegate.For further instructions on troubleshooting your Helm installation, go to Helm troubleshooting guide.
Check the status of the delegate on your cluster:
kubectl describe pods -n <namespace>If the pod did not start, check the delegate logs:
kubectl logs -f <harnessDelegateName> -n <namespace>If the state of the delegate pod is
CrashLoopBackOff, check your allocation of compute resources (CPU and memory) to the cluster. A state ofCrashLoopBackOffindicates insufficent Kubernetes cluster resources.If the delegate pod is not healthy, use the
kubectl describecommand to get more information:kubectl describe <pod_name> -n <namespace>
Use the following steps to troubleshoot your installation of the delegate using Terraform.
Verify that Terraform is correctly installed:
terraform -versionFor further instructions on troubleshooting your installation of Terraform, go to the Terraform troubleshooting guide.
Check the status of the delegate on your cluster:
kubectl describe pods -n <namespace>If the pod did not start, check the delegate logs:
kubectl logs -f <harnessDelegateName> -n <namespace>If the state of the delegate pod is
CrashLoopBackOff, check your allocation of compute resources (CPU and memory) to the cluster. A state ofCrashLoopBackOffindicates insufficent Kubernetes cluster resources.If the delegate pod is not healthy, use the
kubectl describecommand to get more information:kubectl describe <pod_name> -n <namespace>
Use the following steps to troubleshoot your installation of the delegate using Kubernetes.
Check the status of the delegate on your cluster:
kubectl describe pods -n <namespace>If the pod did not start, check the delegate logs:
kubectl logs -f <harnessDelegateName> -n <namespace>If the state of the delegate pod is
CrashLoopBackOff, check your allocation of compute resources (CPU and memory) to the cluster. A state ofCrashLoopBackOffindicates insufficent Kubernetes cluster resources.If the delegate pod is not healthy, use the
kubectl describecommand to get more information:kubectl describe <pod_name> -n <namespace>
Use the following steps to troubleshoot your installation of the delegate using Docker:
Check the status of the delegate on your cluster:
docker container ls -aIf the pod is not running, check the delegate logs:
docker container logs <delegatename> -fRestart the delegate container. To stop the container:
docker container stop <delegatename>To start the container:
docker container start <delegatename>Make sure the container has sufficient CPU and memory resources. If not, remove the older containers:
docker container rm [container id]
Creating Your First SLO
In the Harness Platform, head to Service Reliability -> SLOs inside the Default Project.
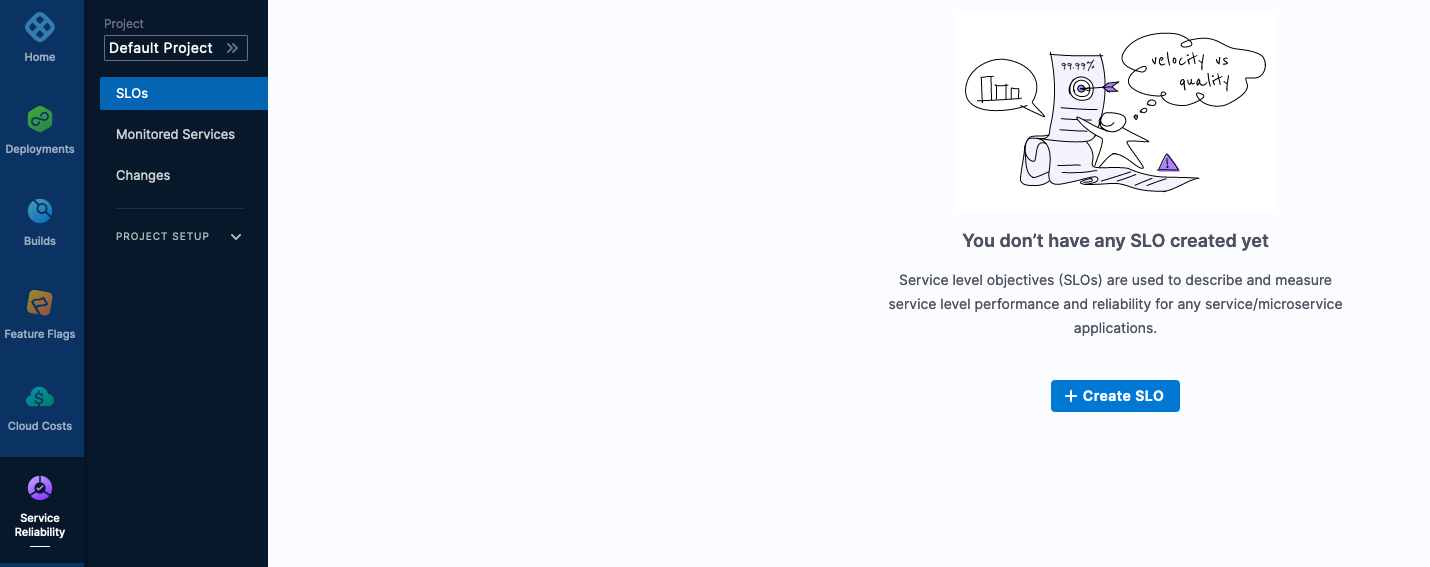
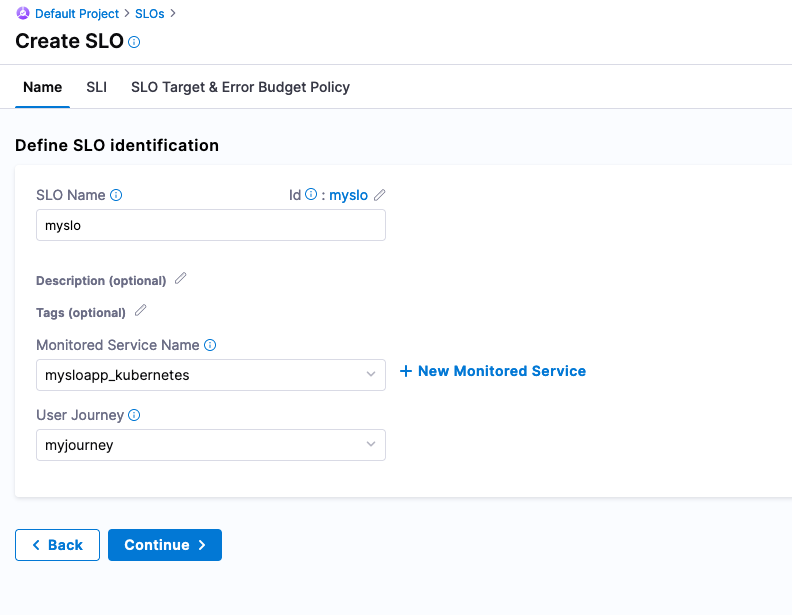
Click on + Create SLO. Can name the SLO, “myslo”. Harness does need to define what you will be monitoring, which is a Monitored Service. In the Monitored Service Name, create a new Monitored Service.
- Service [create in-line]: my-slo-app
- Environment [create-in-line]: kubernetes
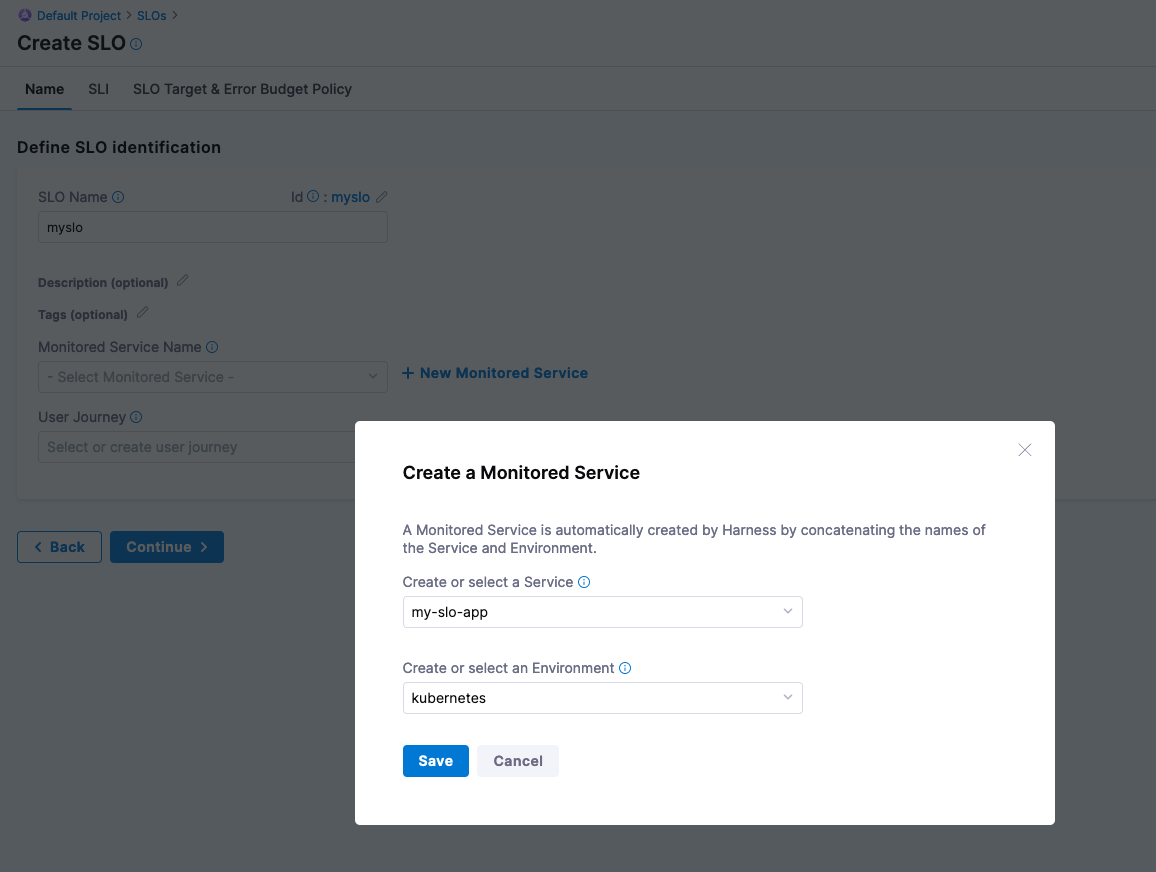
Click Save. Can also name this journey that a user or system will be taking on by creating a new User Journey object. Can create a new User Journey object called “myjourney”.
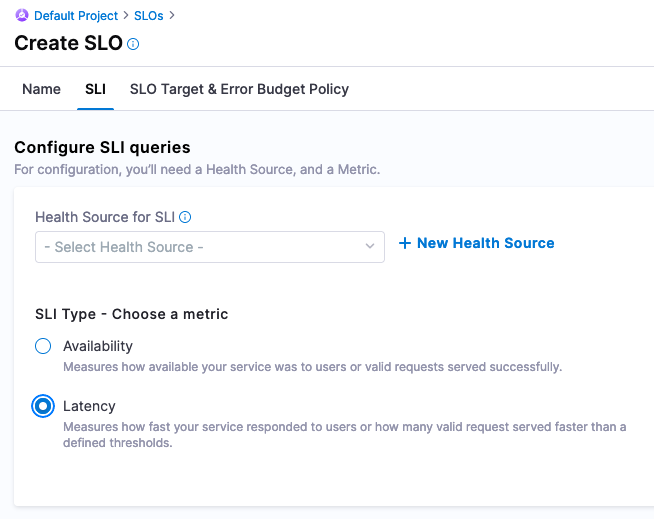
Click Continue. Now you are ready to wire in the Service Level Indicator [SLI] that feed into this SLO. Since the test_summary0_sum{} metric has a consistent upward trend, this can be used to simulate a latency metric. Now you are ready to configure wiring in Prometheus to Harness.
Configure SLI queries -> + New Health Source
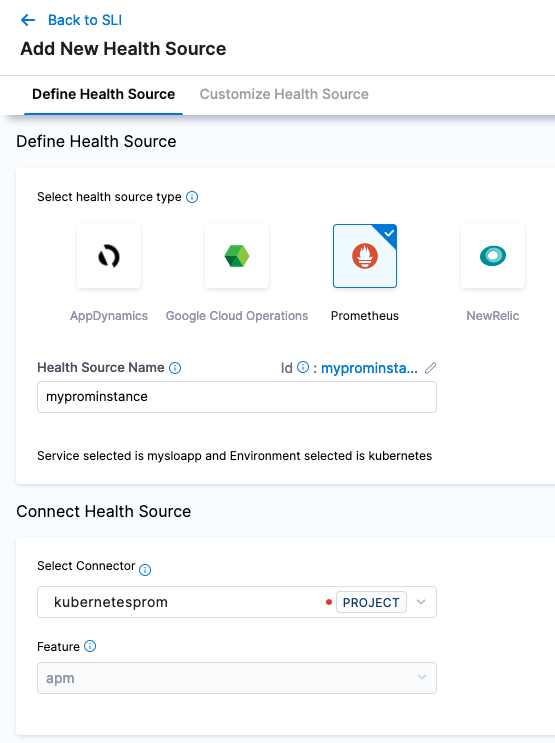
Configuring Prometheus to Harness, add a new Prometheus Health Source with a name of “myprominstance”.
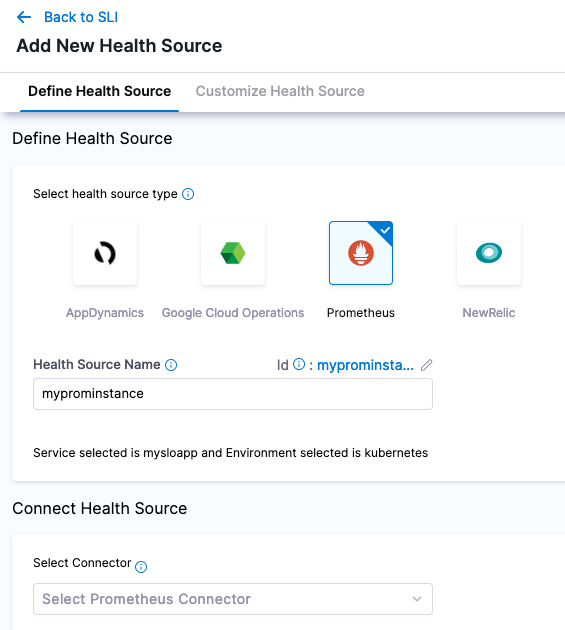
Create a new Prometheus Connector with the name “kubernetesprom”.
In the Credentials Section, can give the NodePort address or the address on how you exposed Prometheus’s 9090 port.
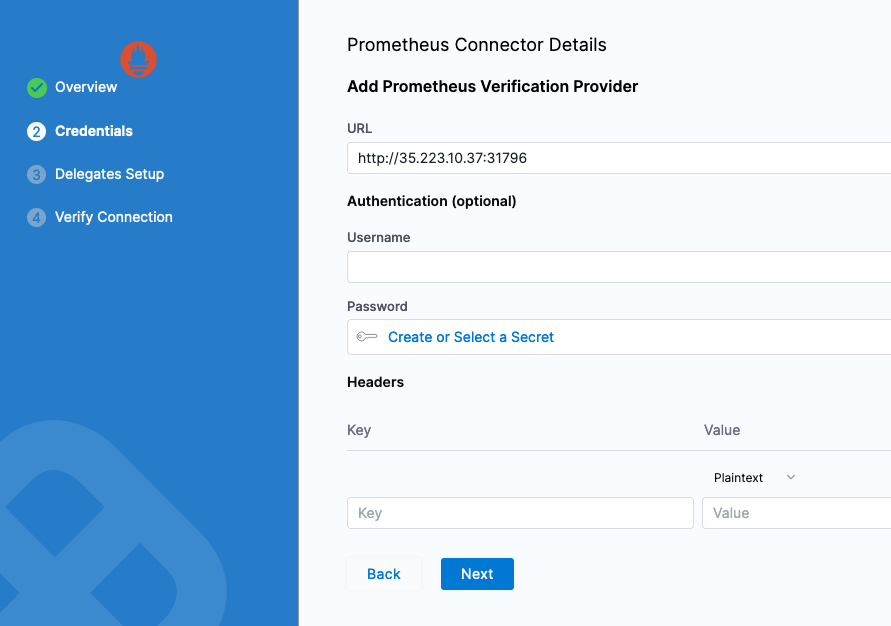
Click Next and select a Harness Delegate to perform this connection. Can select any available Harness Delegate.
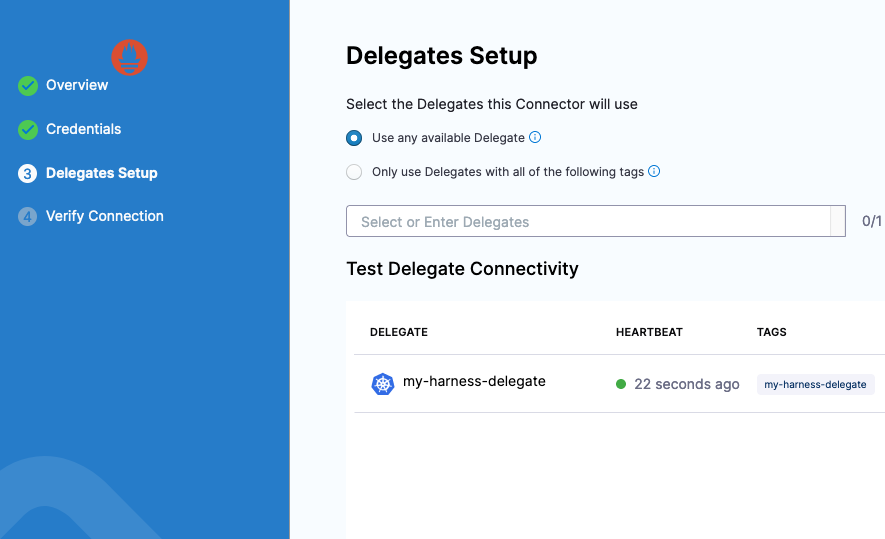
Click Save and your connection to Prometheus will be validated. Now you are ready to wire in the Prometheus Query as a Health Source.
Click Next after wiring in the Connector. Using the Build your Query, the metric we want to focus on is “test_gauge0” and will filter on the “app” field with the example app label, “prometheus-sample-app”. We can duplicate the filter on Environment and Service since that is the singular metric we want.
- Prometheus Metric: test_gauge0
- Environment Filter: app:prometheus-sample-app
- Service Filter: app:prometheus-sample-app
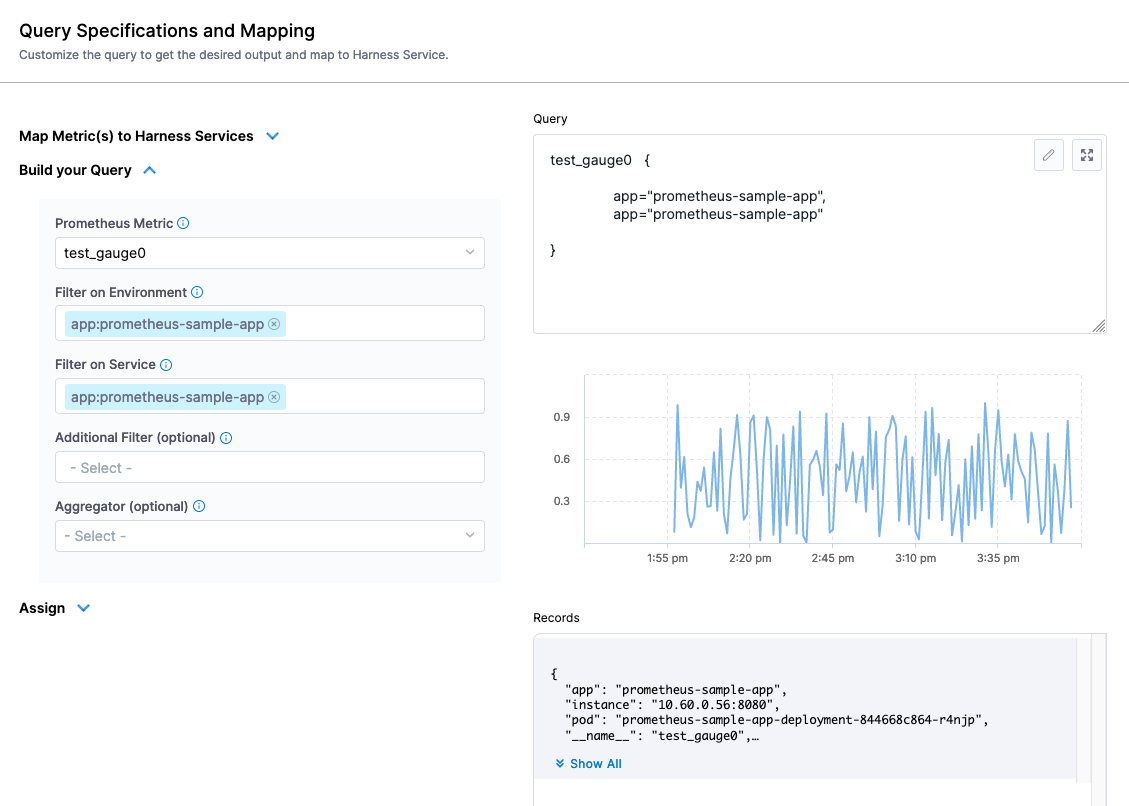
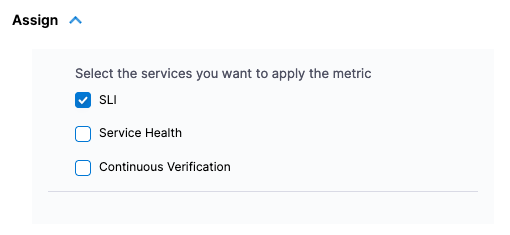
In the Assign section, select this as an SLI.
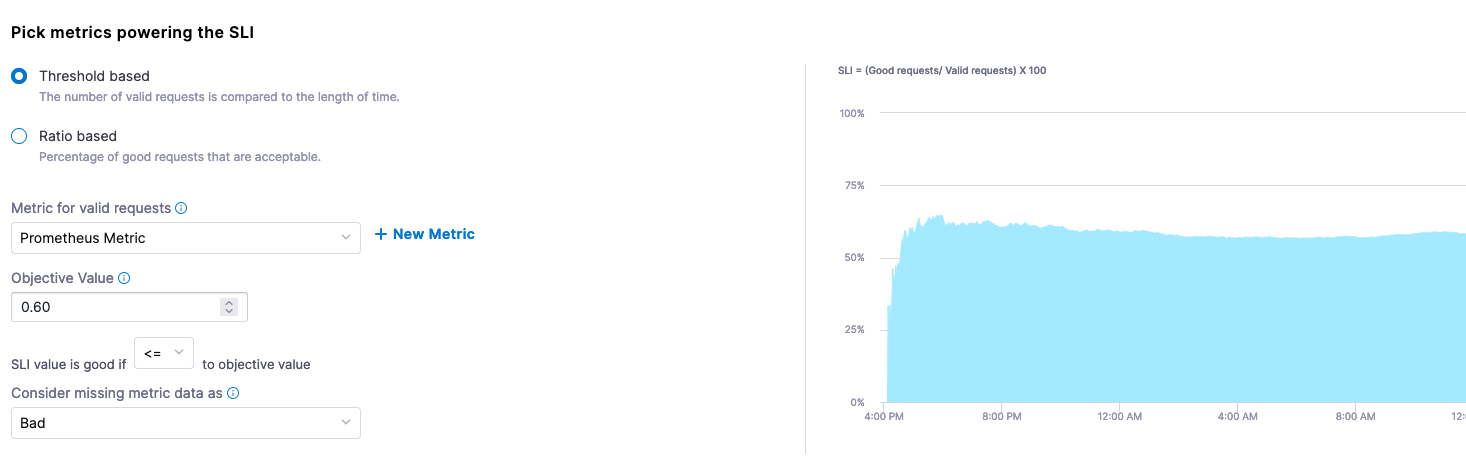
Click Save and now you can pick the metrics powering the SLI. Taking a closer look at the sample Gauge in Prometheus, a sample of 0.60 seems to be a good midpoint on this metric going up and down. We can pretend that this Gauge represents some sort of response time metric and the lower the score, the better.
When configuring the SLI, can set this to a Threshold based metric. The Objective Value of what we are stating is “good” is less than or equal to 0.60. If data is missing in our Gauge, we can also consider this “bad”.
Metric for valid requests: Prometheus Metric [was connected during the connecting step].
- Objective Value: 0.60
- SLI value is good if: <=
- Consider missing data: Bad
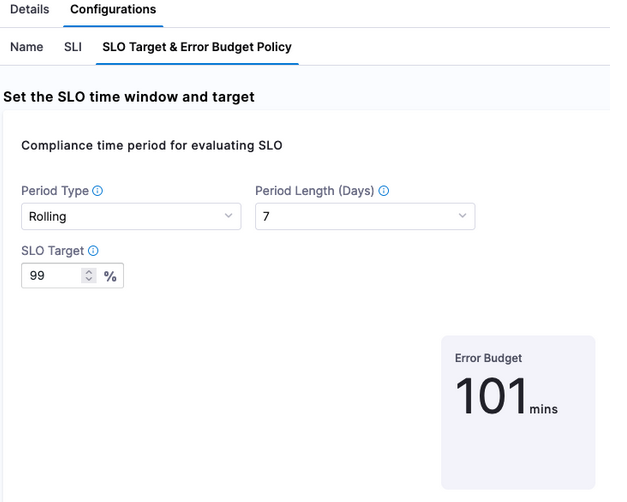
Set SLO Target
Click Continue to set up the SLO Target [based on the SLI] and Error Budget [amount of time system can fail] Policy. A goal we can set is that 50% of requests need to be <= to our Objective Value e.g this is our SLI. Since we are setting 50% of the target, we are also stating that 50% of the week if we set a rolling 7 day period can be included in our Error Budget which is indicated by Harness.
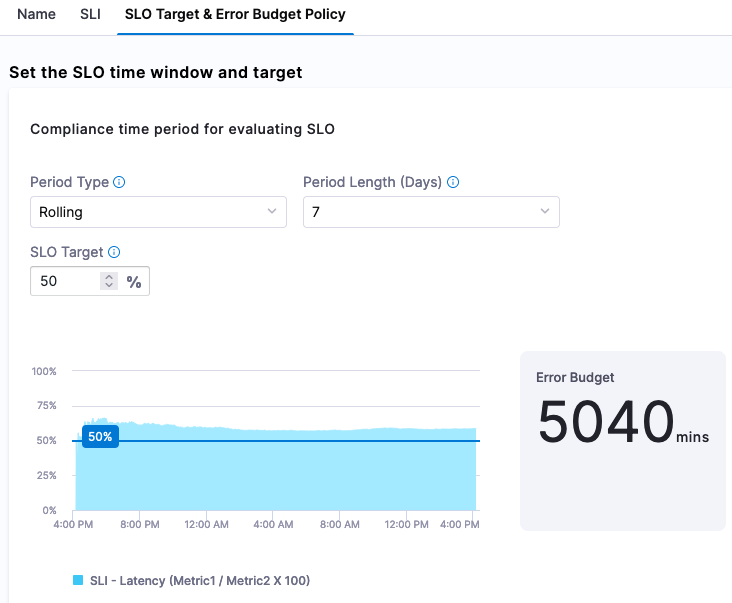
Click Save and now you have the ability to actively monitor and manage your SLOs. SLOs can be renegotiated much easier with Harness without having to calculate them.
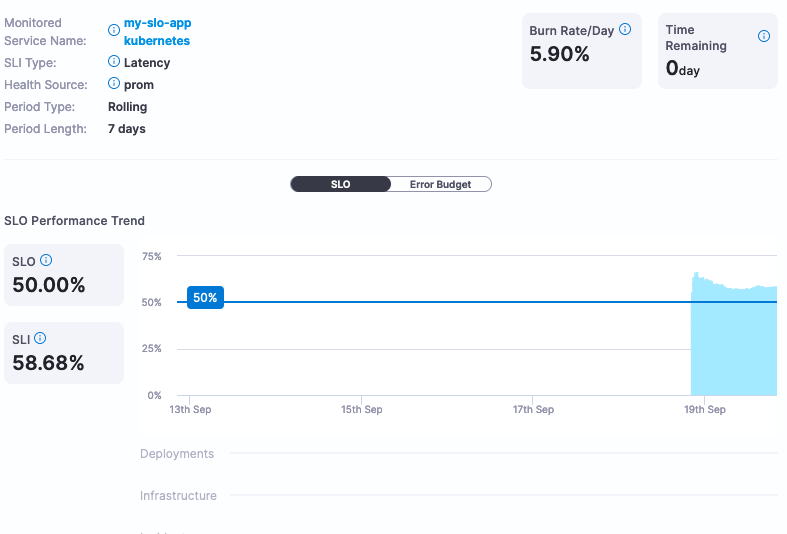
If this SLO is too aggressive or too lenient, Harness can provide the actual service data to help make that determination. In this example, we set the SLO target at 50% which is not a very good SLO. Changing the SLO target to be more aggressive, for example 99%, can be changed via the UI.