Datadog
Harness CV integrates with Datadog to:
- Verify if the deployed service is running safely and performing automatic rollbacks.
- Apply machine learning to every deployment to identify and flag anomalies in future deployments.
This topic covers how to add and configure Datadog as a Health Source for the Verify step.
Before You Begin
Add Datadog as a verification provider
Review: CV Setup Options
To use the Verify step, you will need a Harness Service Reliability Management Monitored Service. In the simplest terms, a Monitored Service is basically a mapping of a Harness Service to a service monitored by your APM or logging tool.
You can set up a Monitored Service in the Service Reliability Management module or in the Verify step in a CD stage. The process is the same.
No matter where you set up the Monitored Service, once it's set up, it's available to both Service Reliability Management and CD modules.
In this topic we'll set up the Monitored Service as part of the Verify step.
Step 1: Add Verify Step
There are two ways to add the Verify step:
- When selecting the stage deployment strategy:
The Verify step can be enabled in a CD stage the first time you open the Execution settings and select the deployment strategy. When you select the deployment strategy you want to use, there is also an Enable Verification option. Select the Enable Verification option.
Harness will automatically add the Verify step. For example, here is a stage where Canary strategy and the Enable Verification option were selected.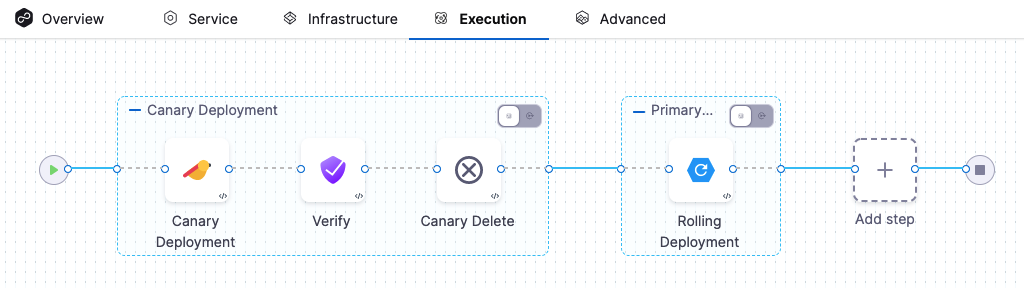
- Add the Verify step to an existing Execution setup: You can also add the Verify step to the Execution section of a CD stage in a Pipeline you previously created. Simply click Add Step after the deployment step, and then select Verify.

Step 2: Enter Name and Timeout
In Name, enter a name for the step.
In Timeout, enter a timeout value for the step.
You can use:
wfor weeksdfor dayshfor hoursmfor minutessfor secondsmsfor milliseconds
The maximum is 53w. Timeouts can be set at the Pipeline level also.
Node filtering
Currently, this feature is behind the feature flag SRM_SUMO. Contact Harness Support to enable the feature.
This feature allows you to be more specific in node filtering by using Kubernetes PodName as a label. You can make analysis more explicit by telling CV which nodes to filter on. Just specify the filters on the control nodes (nodes that test nodes are compared against) and the test nodes (nodes CV checks).
To filter the nodes:
Expand Optional.
Choose Control Nodes and Test Nodes that Harness CV should focus on during analysis. You can either type a node’s name or use a simple pattern (Regex) to define the nodes you want to filter.
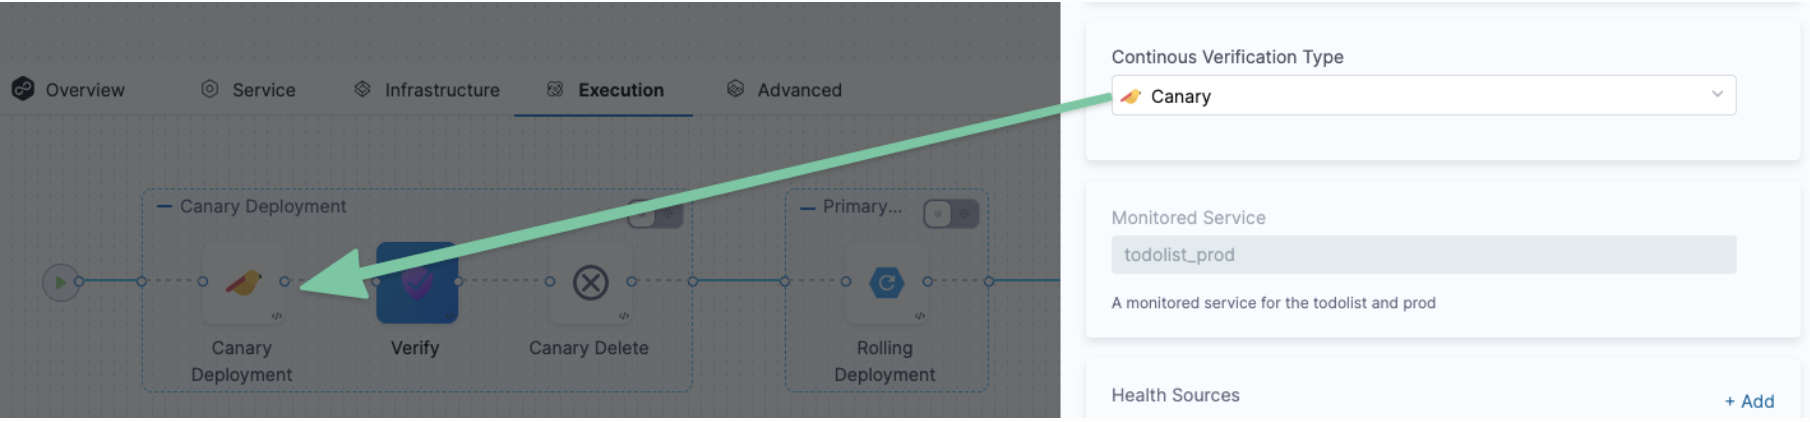
Step 3: Select a Continuous Verification Type
In Continuous Verification Type, select a type that matches your deployment strategy.
Step 4: Create a Monitored Service
In Monitored Service, click Click to autocreate a monitored service.
Harness automatically creates a monitored service using a concatenation of the service and environment names. For example, a service named todolist and an environment named dev results in a monitored service with the name todolist_dev.
The option to auto-create a monitored service is not available if you have configured either a service, an environment, or both as runtime values. When you run the pipeline, Harness concatenates the service and environment values you enter in the runtime inputs screen and generates a monitored service name. If a monitored service with the same name exists, Harness assigns it to the pipeline. If no monitored service that matches the generated monitored service name exists, Harness skips the verification step.
For example, suppose you enter the service as todolist and the environment as dev. In that case, Harness generates the monitored service name todolist_dev, checks whether a monitored service with the name todolist_dev is available, and assigns it to the pipeline. If no monitored service is available with the name todolist_dev, Harness skips the verification step.
Step 5: Add Health Sources
This option is available only if you have configured the service and environment as fixed values.
A Health Source is basically a mapping of a Harness Service to the service in a deployment environment monitored by an APM or logging tool.
In Health Sources, click Add. The Add New Health Source settings appear.
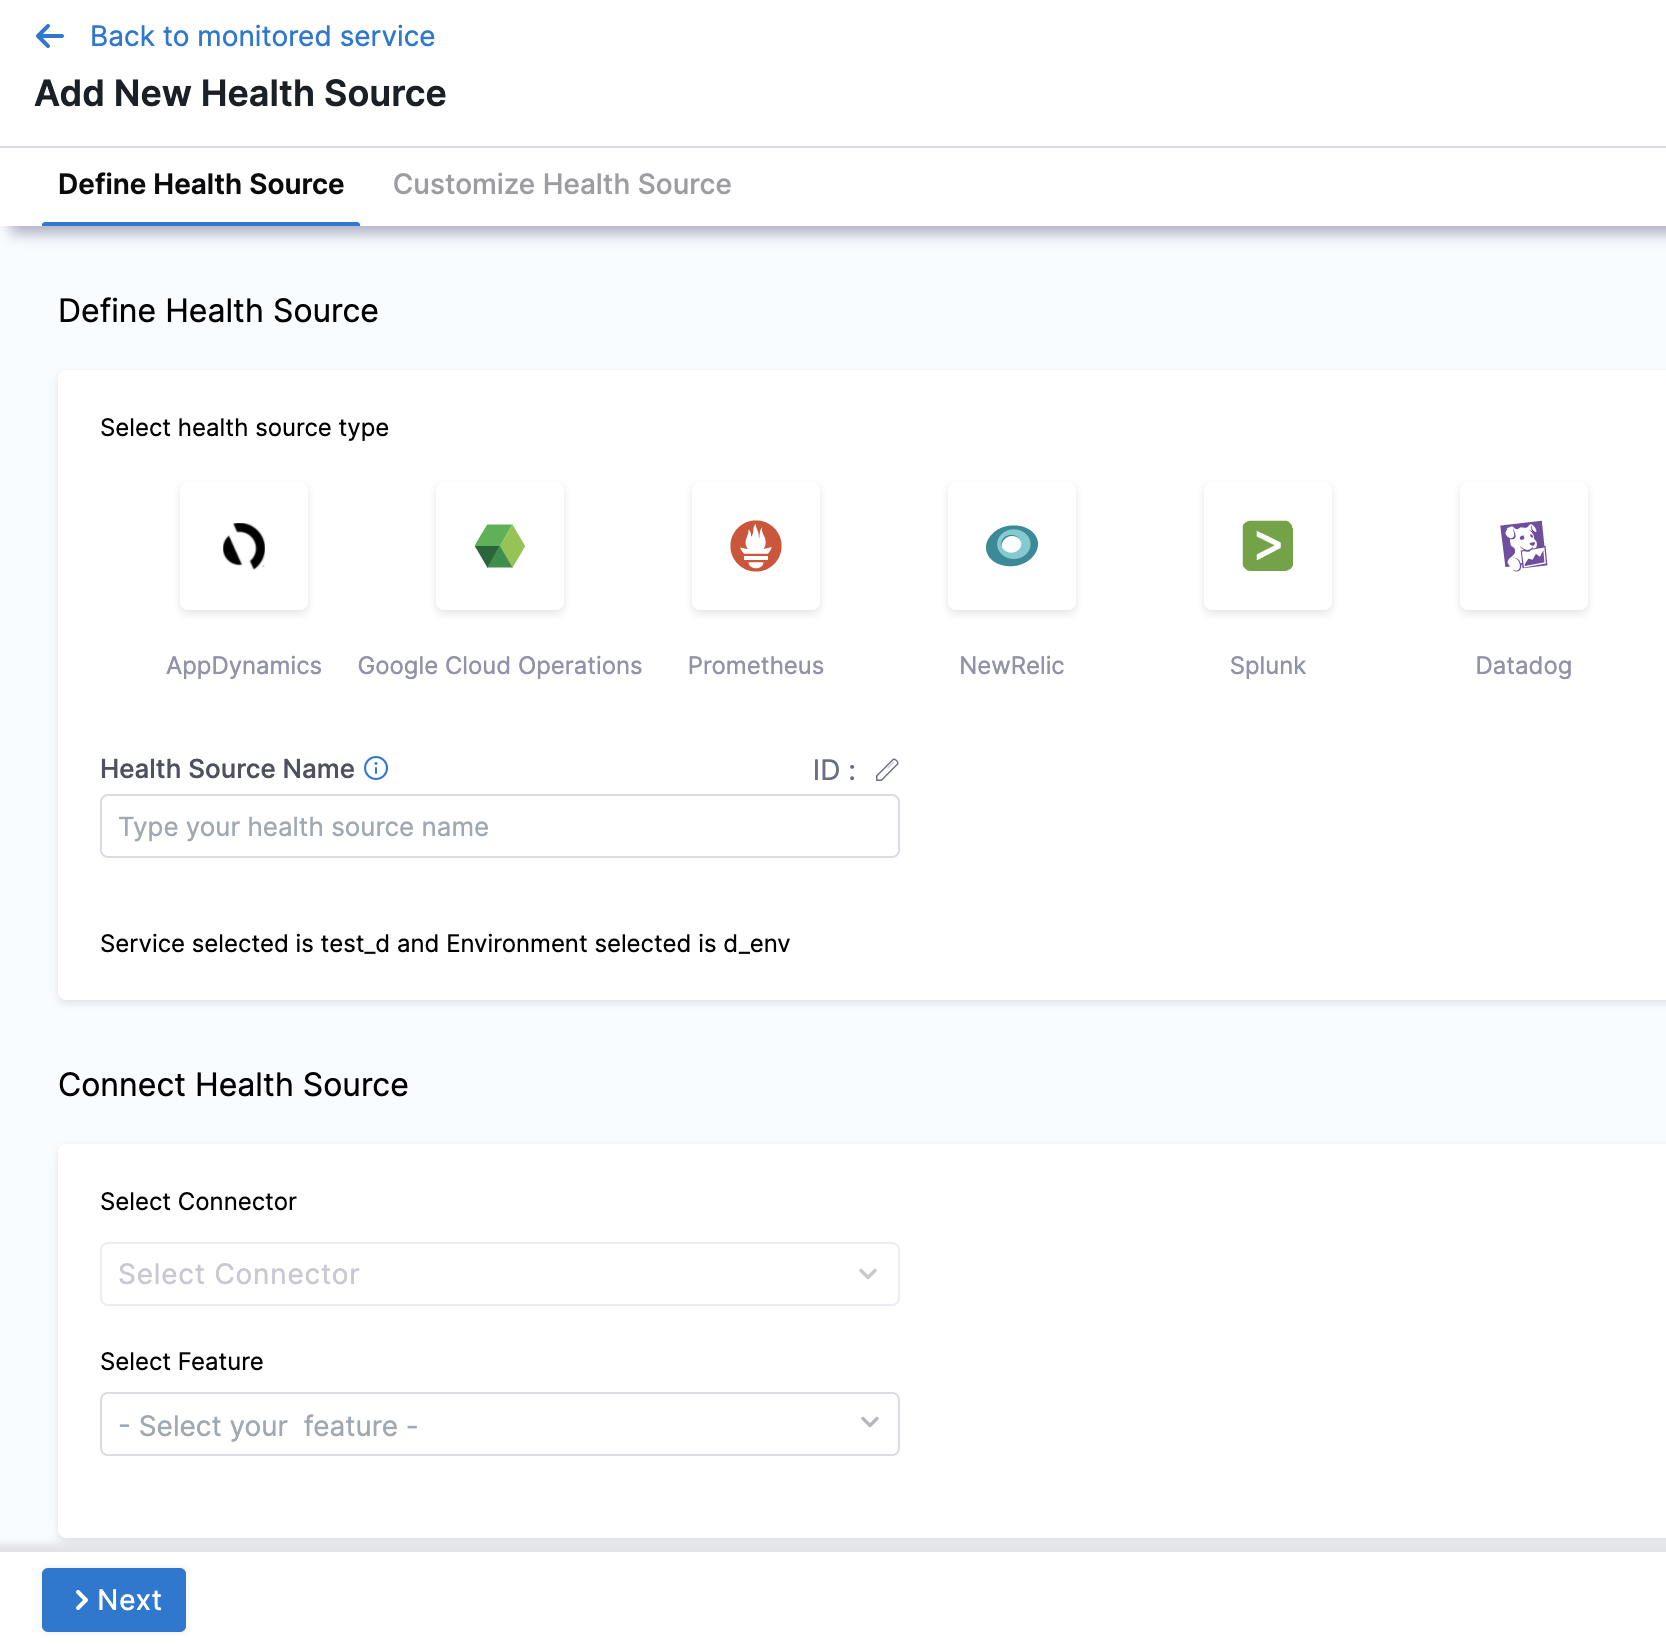
In Select health source type, select Datadog.
In Health Source Name, enter a name for the Health Source.
Under Connect Health Source, click Select Connector.
In Connector settings, you can either choose an existing connector or click New Connector.
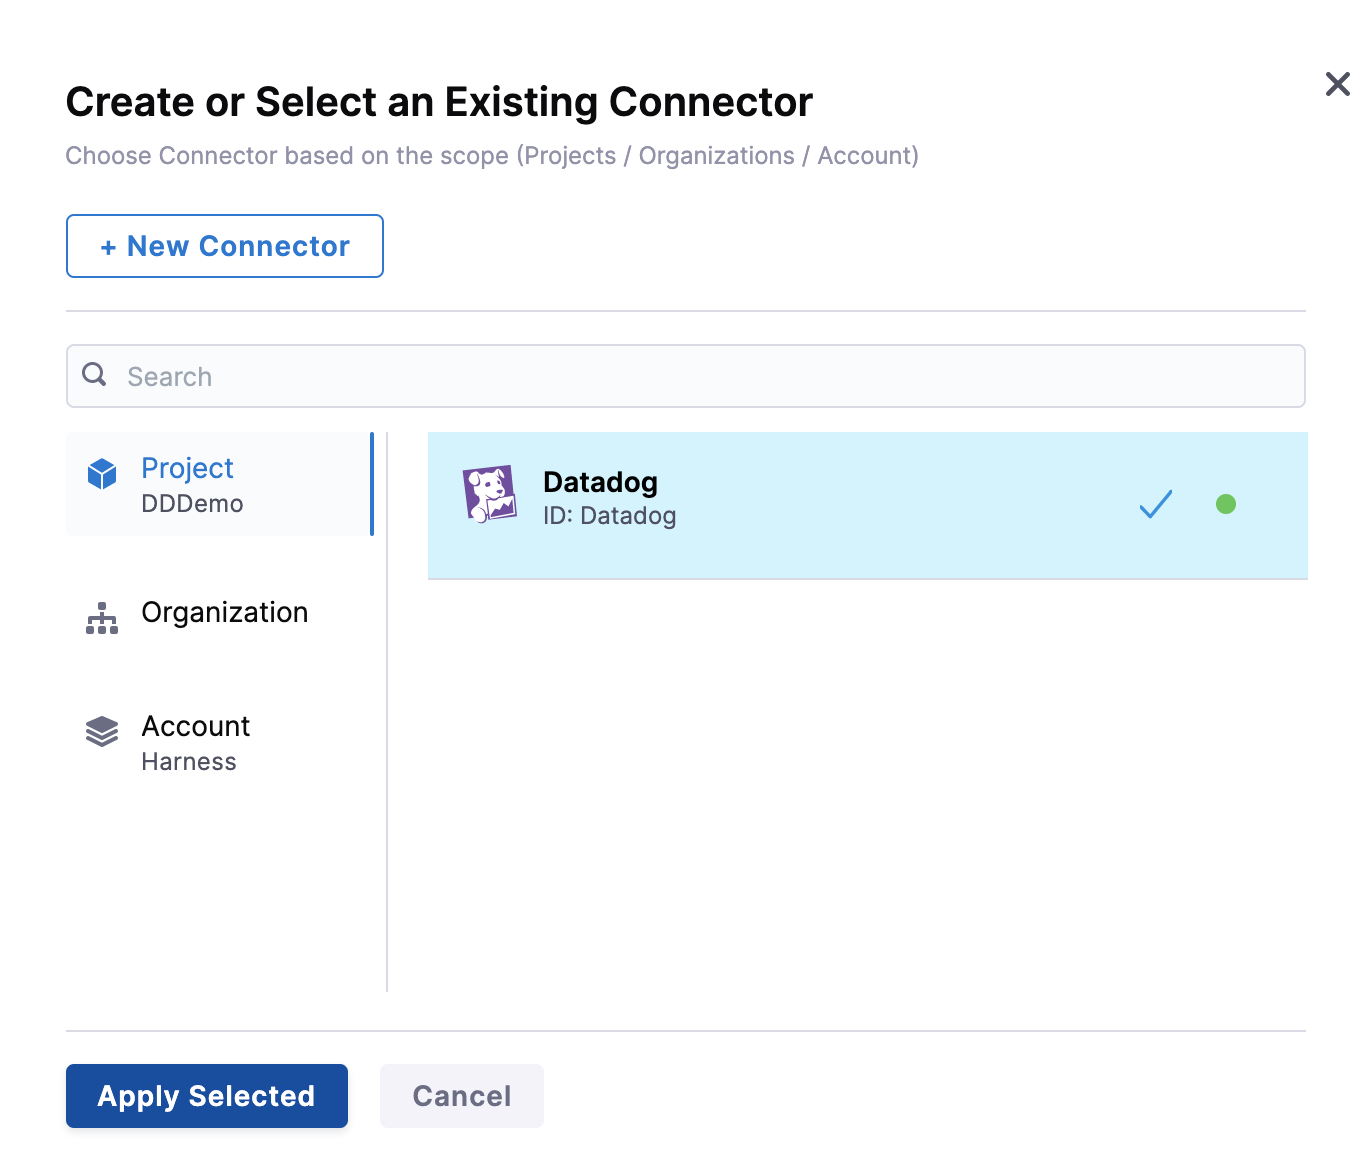
Click Apply Selected. The Connector is added to the Health Source.
In Select Feature, select the Datadog feature to be used. You can choose Cloud Metrics or Cloud Logs.
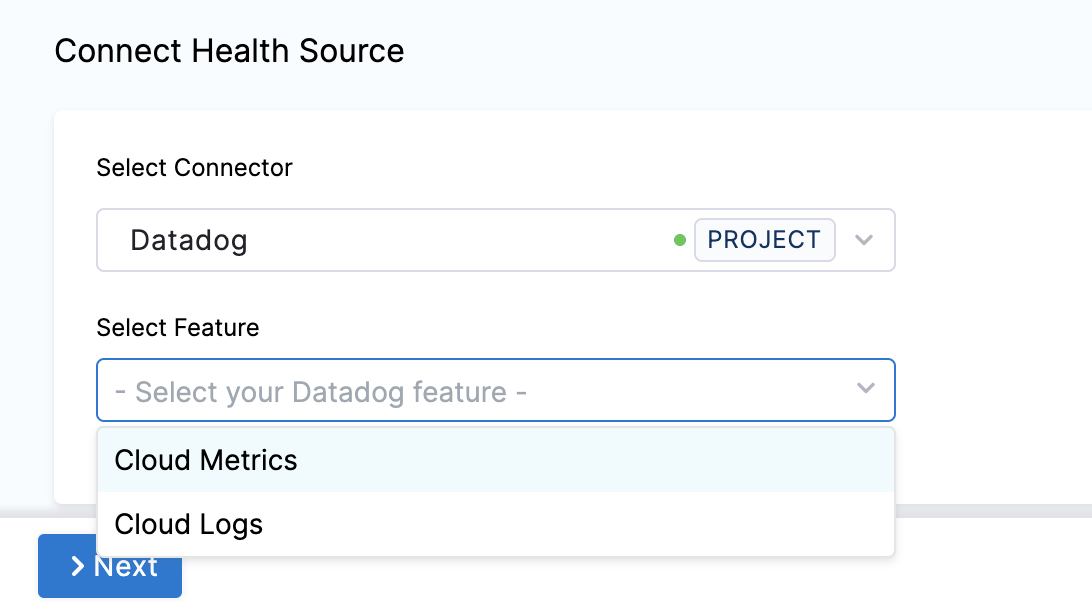
Click Next.
The subsequent settings in Customize Health Source depend on the Health Source Type you selected. ### Option: Cloud Metrics
If you select Cloud Metrics, the Select Dashboards settings appear. It displays a list of Datadog dashboards.
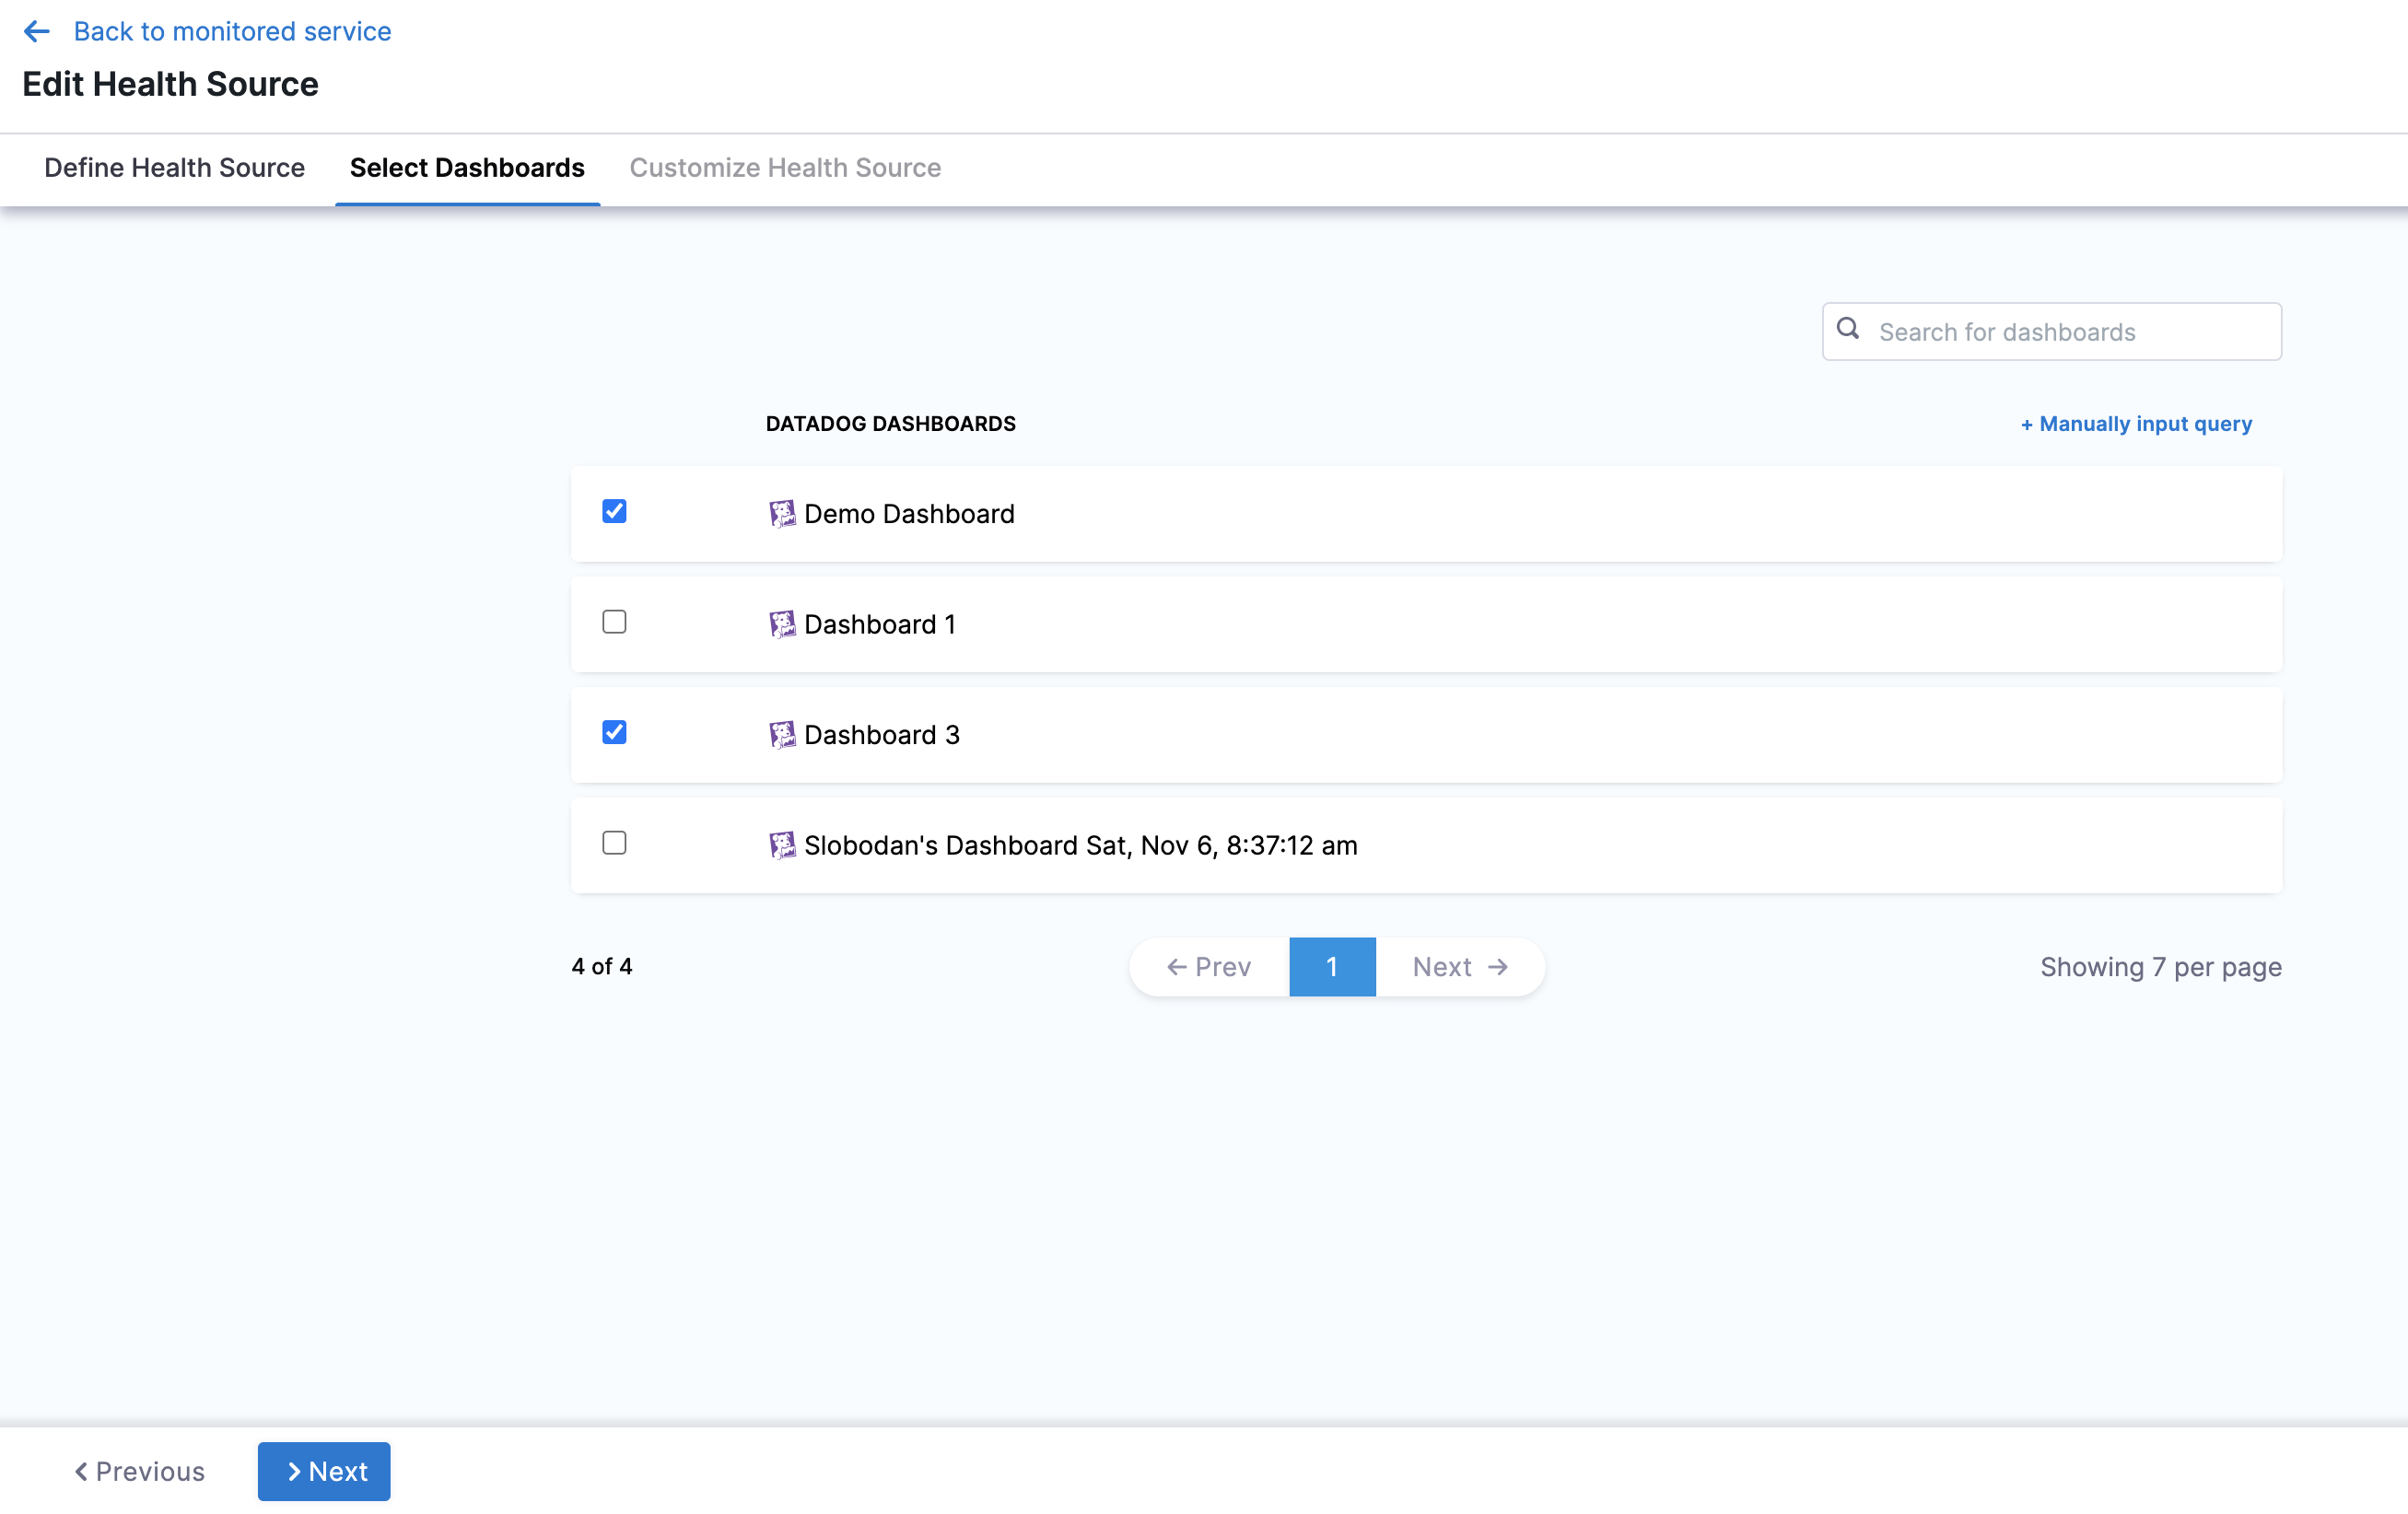
Click the dashboards of your choice. If you don't have any preexisting dashboards or don't want to select the ones in the displayed result, click Manually input query.
Click Next and the Customize Health Source settings appear.
Select a query from the options displayed on the left side of setting panel. The specification of the selected query auto-populates in the fields under Query Specifications.
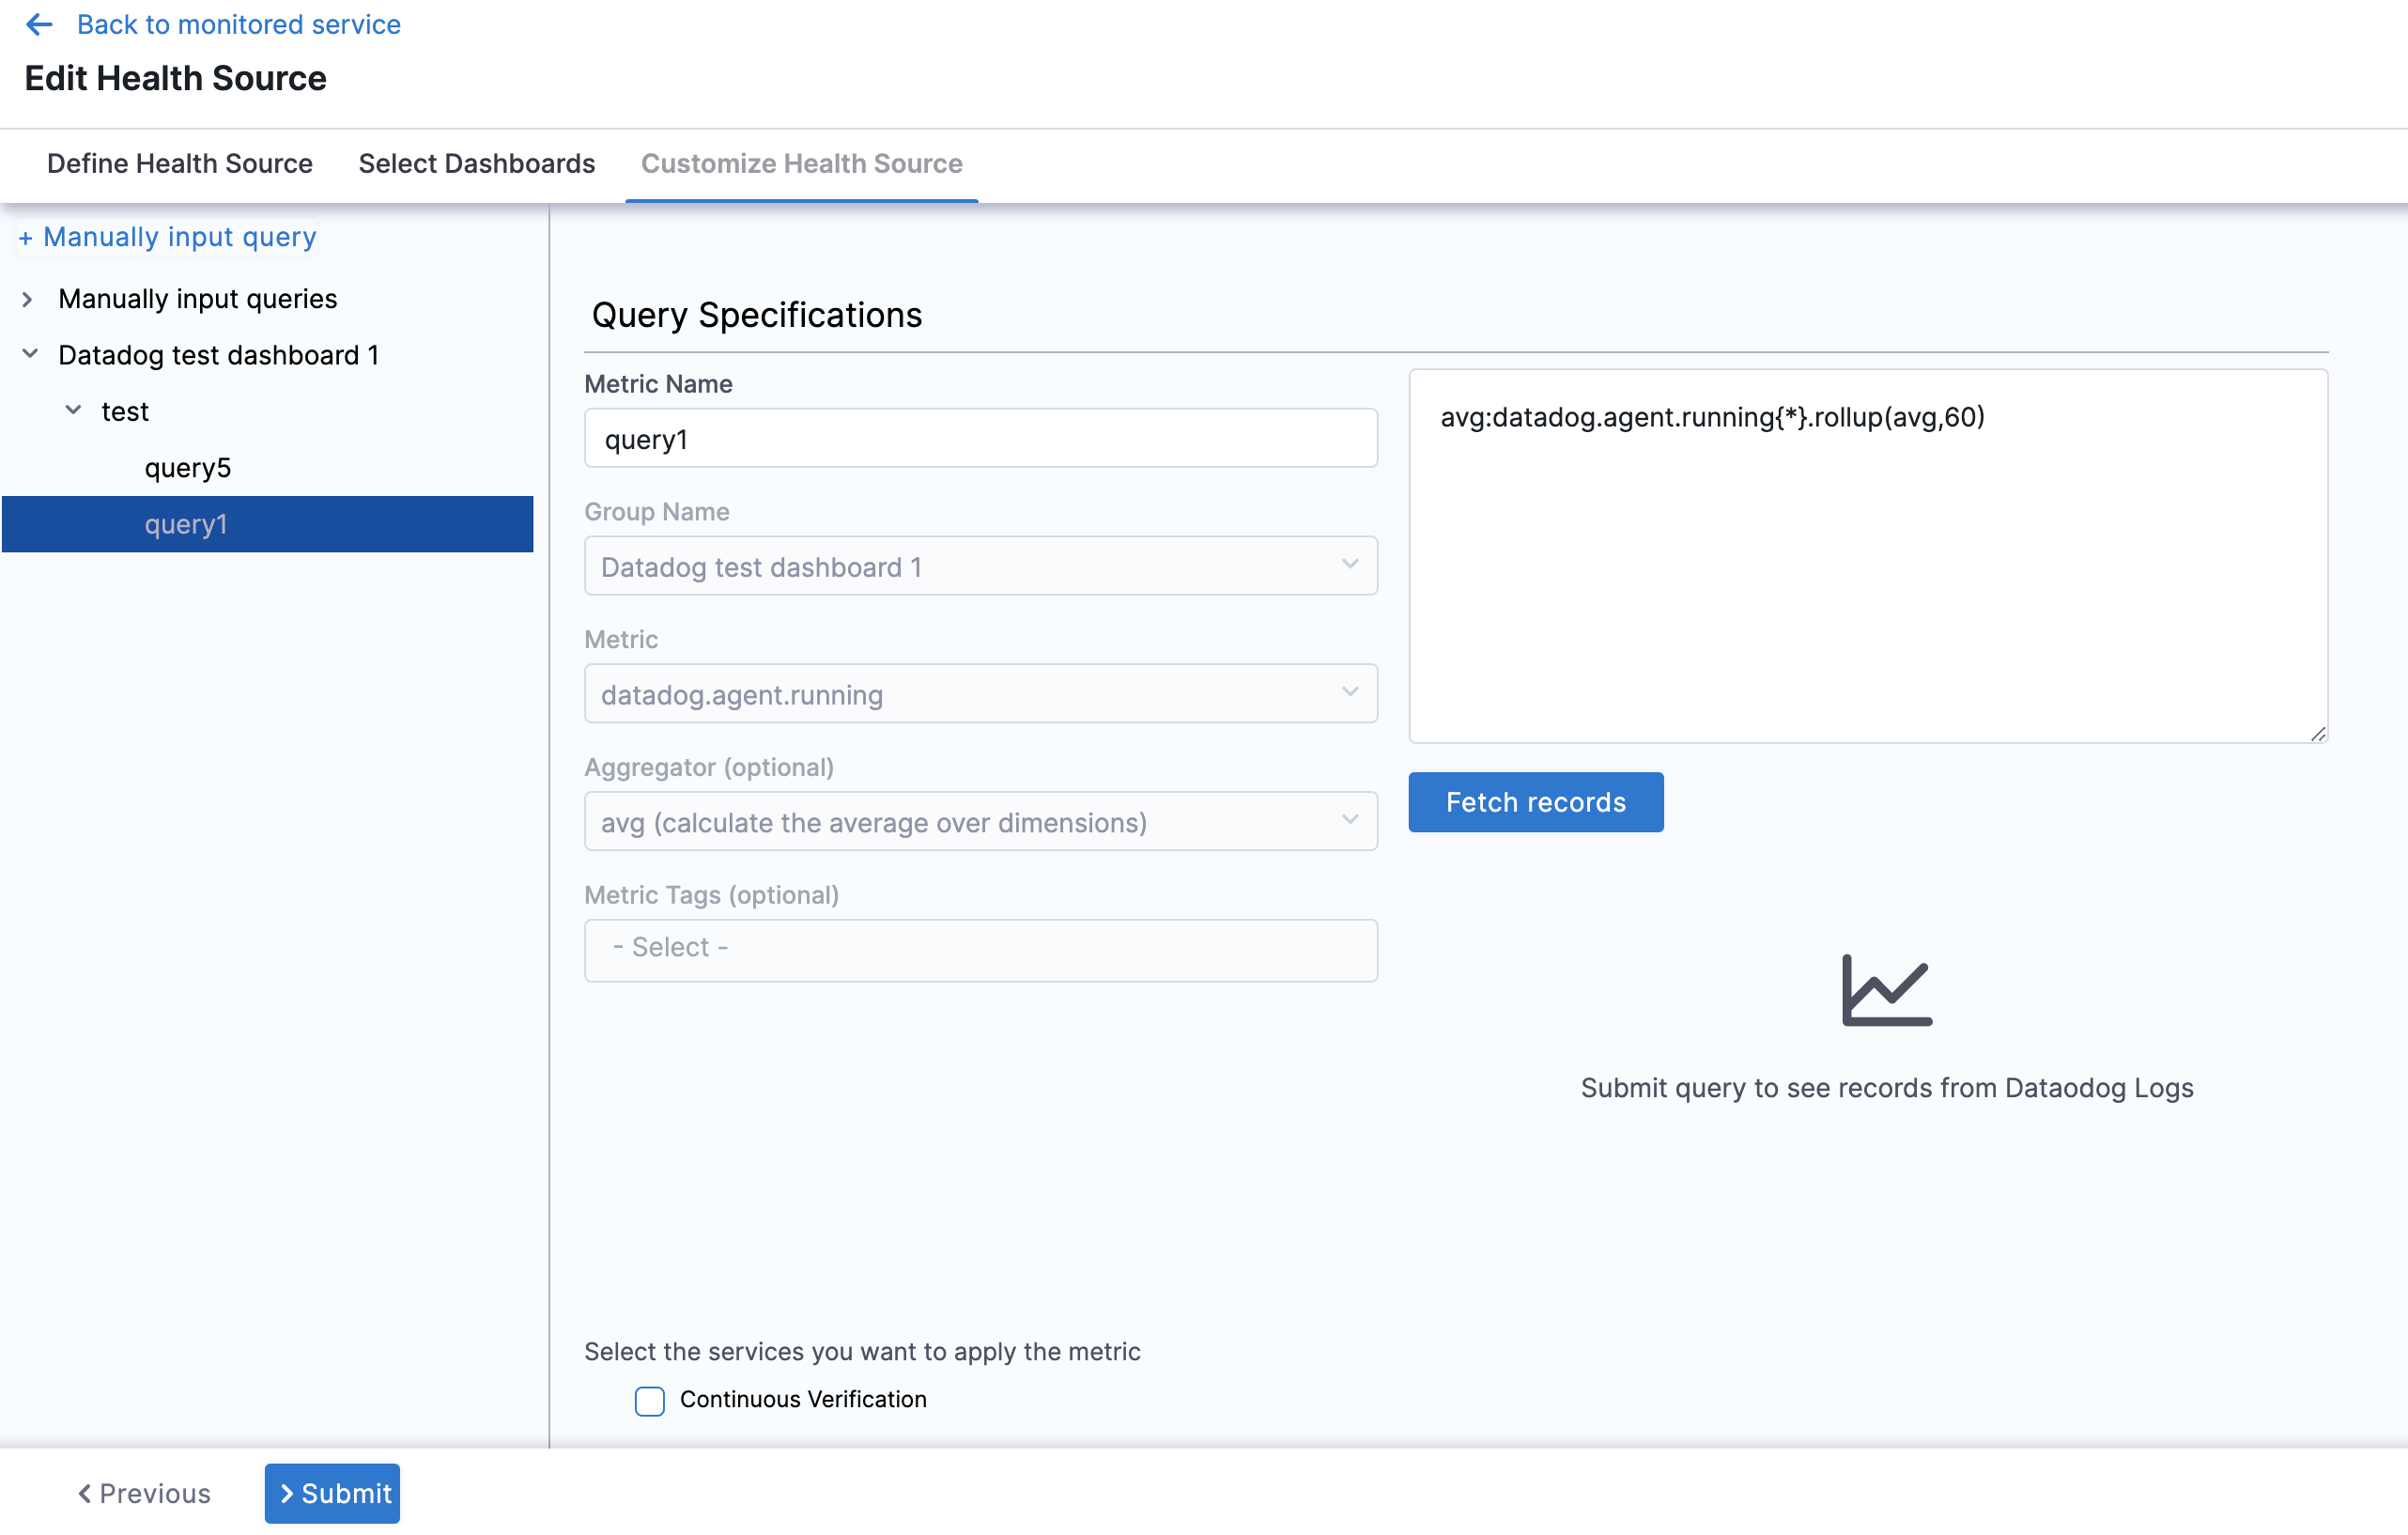
Click Submit. The Health Source is displayed in the Verify step.
Configure Datadog formulas as Harness queries
Currently,this feature is behind the feature flag SRM_DATADOG_METRICS_FORMULA_SUPPORT. Contact Harness Support to enable the feature.
In manual query mode, the Datadog metrics health source provides support for formulas. These formulas follow a specific format:
Query a ; Query b ; Formula using a, b
- Query a: "Query-with-a"
- Query b: "Query-with-a"
- The formula is "(a/b) * 100 - 5"
Let's consider an example to illustrate this:
kubernetes.cpu.usage{cluster-name:chi-play};kubernetes.memory.total{cluster-name:chi-play};(a/b) * 100 - 5
In the example above, 'a' and 'b' represent the respective queries:
- a = kubernetes.memory.usage{cluster-name:chi-play}
- b = kubernetes.memory.total{cluster-name:chi-play}
You can use multiple queries represented by alphabetical variables (example: a, b, c, and so on) in the final formula, but only one formula is allowed per query.
Option: Cloud Logs
Select Cloud Logs and click Next. The Customize Health Source settings appear.
You can customize the metrics to map the Harness Service to the monitored environment in Query Specifications and Mapping settings.
Click Map Queries to Harness Services dropdown.
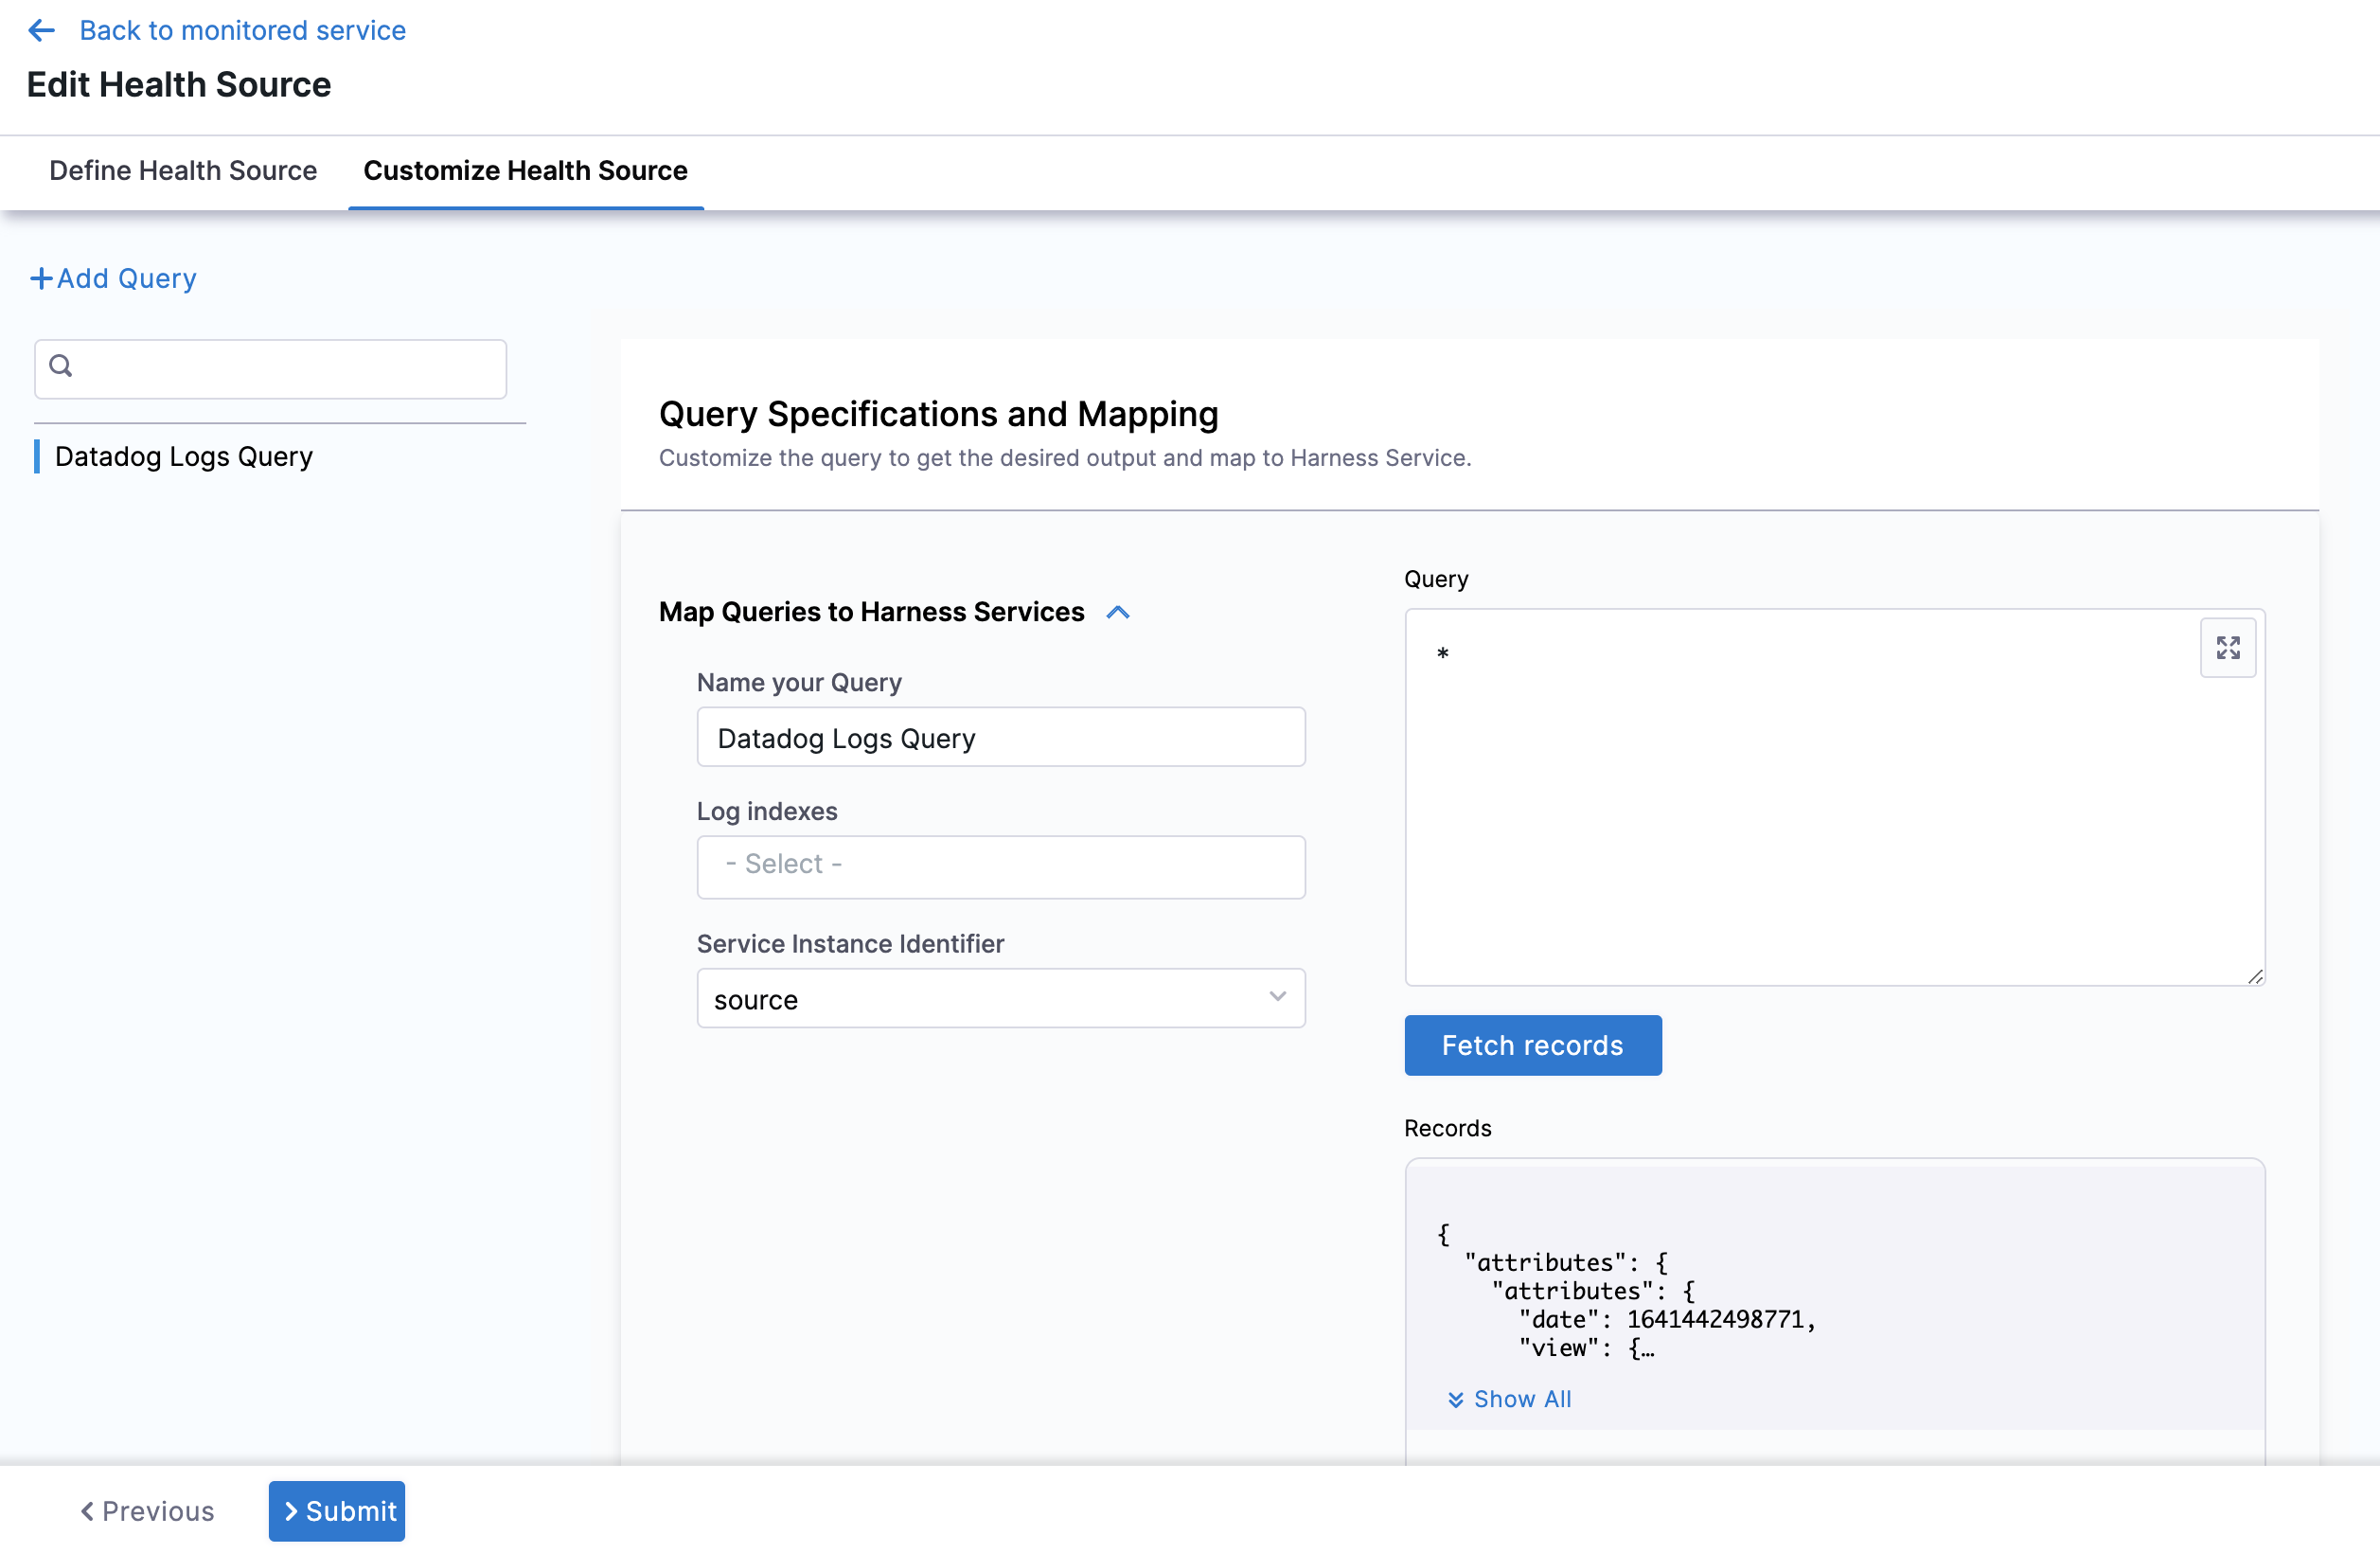
Enter a name for the query in Name your Query.
In Log Indexes, select a log index from the list.
In Service Instance Identifier, click the drop-down to select the path of the service instance.
Click Submit. The Health Source is displayed in the Verify step.
Step 6: Select Sensitivity
In Sensitivity, select High, Medium, or Low based on the risk level used as failure criteria during the deployment.
Step 7: Select Duration
Select how long you want Harness to analyze and monitor the logs/APM data points. Harness waits for 2-3 minutes to allow enough time for the data to be sent to the APM/logging tool before it analyzes the data. This wait time is a standard with monitoring tools.
The recommended Duration is 10 min for logging providers and 15 min for APM and infrastructure providers.### Step 8: Specify Artifact Tag
In Artifact Tag, use a Harness expression
The expression <+serviceConfig.artifacts.primary.tag> refers to the primary artifact.
Option: Advanced Settings
In Advanced, you can select the following options:
Step 9: Deploy and Review Results
After setting up the Verify step, click Apply Changes.
Click Run to run the pipeline.
In Run Pipeline, select the tag for the artifact if a tag was not added in the Artifact Details settings.
Click Run Pipeline.
When the Pipeline is running, click the Verify step. You can see that the verification takes a few minutes.
Once verification is complete, the Verify step shows the following:
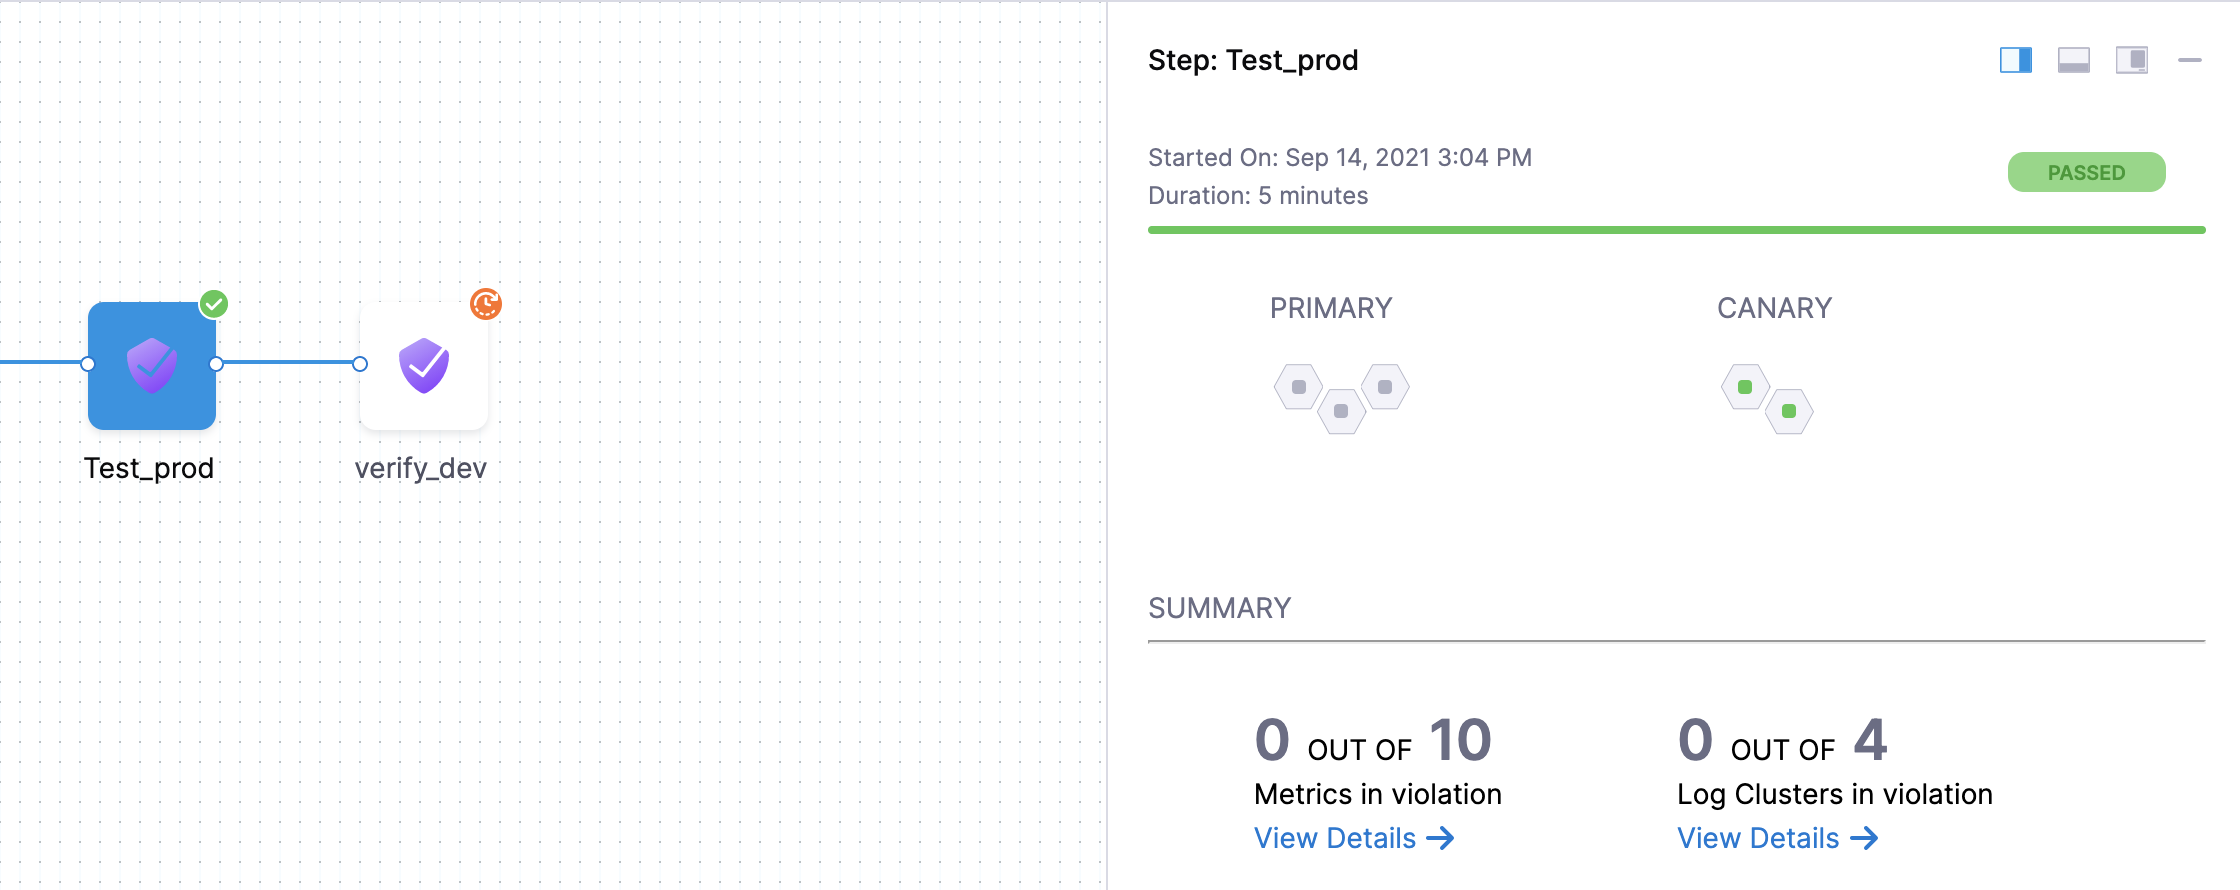
The risk level might initially display a number of violations, but the red and orange colored host often change to green over the duration.
Summary
The Summary section shows the number of logs and metrics that are in violation.
Console View
Click Console View or simply click View Details in Summary to take a deeper look at verification.
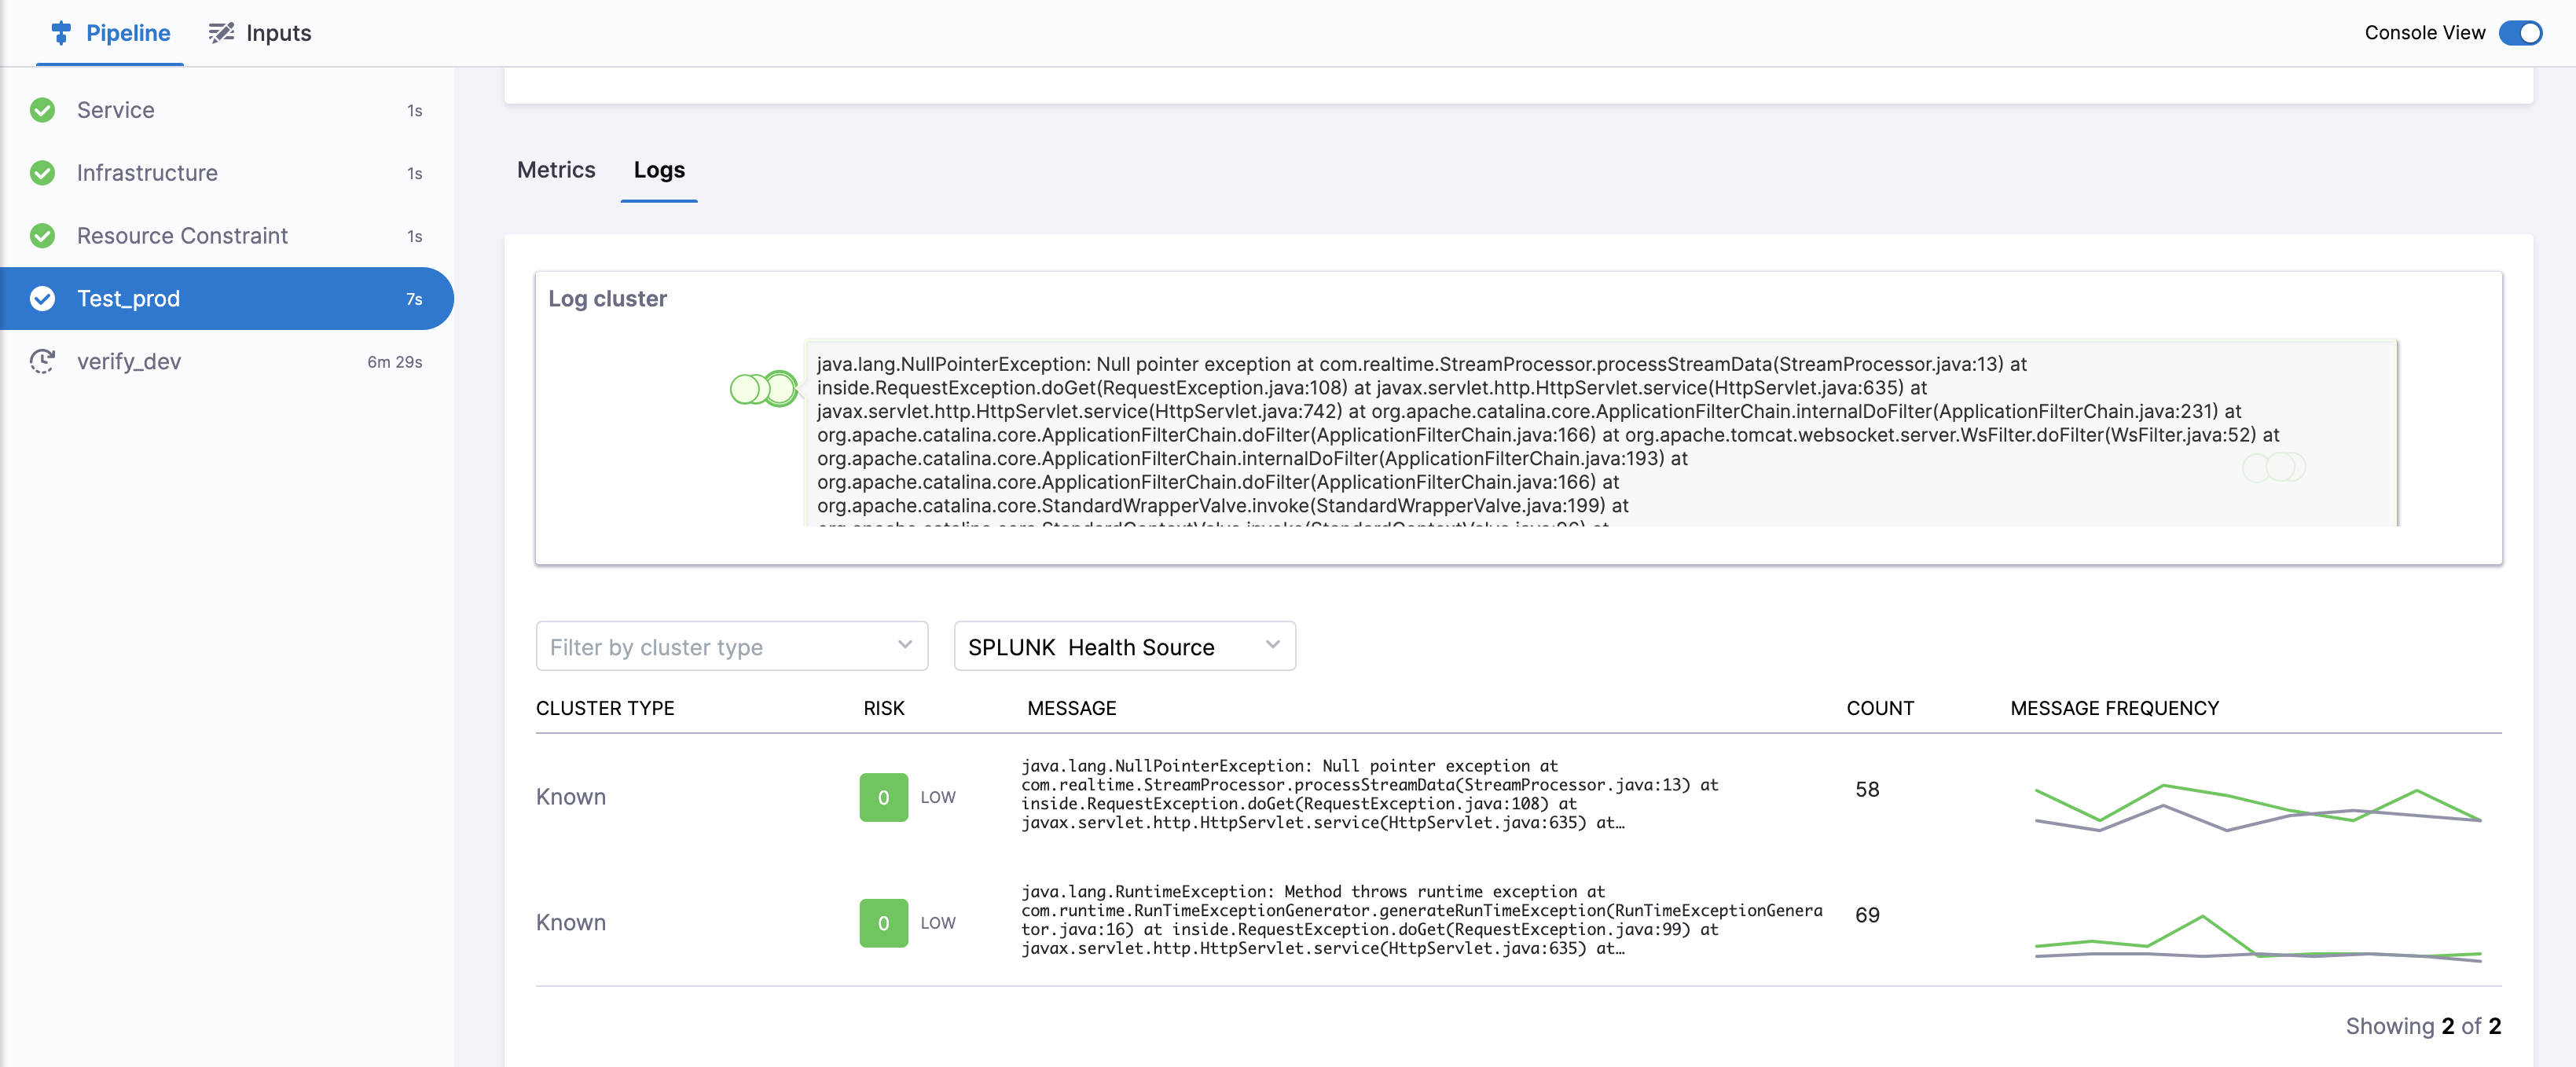
Click Filter by Cluster Type to drill down the metrics based on known events, unknown events, or unexpected frequency.
Set a pinned baseline
Currently, this feature is behind the feature flag SRM_ENABLE_BASELINE_BASED_VERIFICATION. Contact Harness Support to enable the feature.
You can set specific verification in a successful pipeline execution as a baseline. This is available with Load Testing as the verification type.
Set successful verification as a baseline
To set a verification as baseline for future verifications:
In Harness, go to Deployments, select Pipelines, and find the pipeline you want to use as the baseline.
Select the successful pipeline execution with the verification that you want to use as the baseline.
The pipeline execution is displayed.
On the pipeline execution, navigate to the Verify section, and then select Pin baseline.
The selected verification is now set as the baseline for future verifications.
Replace an existing pinned baseline
To use a new baseline from a pipeline and replace the existing pinned baseline, follow these steps:
In Harness, go to Deployments, select Pipelines, and find the pipeline from which you want to remove the baseline.
Select the successful pipeline execution with the verification that you have previously pinned as the baseline.
On the pipeline execution, navigate to the Verify section, and then select Pin baseline.
A confirmation alert message appears, asking if you want to replace the existing pinned baseline with the current verification. After you confirm, the existing pinned baseline gets replaced with the current verification.