Enable Test Intelligence
Test Intelligence applies to unit testing only. For other types of tests, use Run steps to run tests.
Testing is an important part of Continuous Integration (CI). Testing safeguards the quality of your product before shipping. However, test cycles often involve many tests, and it can take a significant amount of time for the tests to run. Additionally, the tests that run might be irrelevant to the code changes that triggered the build, and running all unit tests every time the code changes is expensive and time-consuming.
Harness Test Intelligence (TI) improves unit test time by running only the unit tests required to confirm the quality of the code changes that triggered the build. You can also use parallelism (test splitting) with TI to further optimize your test times.
Using TI doesn't require you to change your build and test processes. To enable TI, add a Run Tests step and generate a call graph. The Run Tests step executes one or more tests on a container image. The first time you enable TI on a repo, you must use a webhook-based PR trigger to generate an initial call graph, which sets the baseline for test selection in future builds.
Video summary
The following video walks you through setting up Test Intelligence in a Harness CI pipeline. The TI section starts after the 11 minute mark in the video.
How does Test Intelligence work?
Test Intelligence uses test selection to run only those tests that are relevant to code changes. This includes changes to your software's code, as well as changes to your tests (new or modified tests). Instead of always running all unit tests, TI selects only the relevant subset of unit tests and skips the rest.
When you perform a pull request, TI uses the following metrics to select tests:
- Changed code: TI queries Git to learn exactly which code changed in a specific build. TI uses this data to select tests that are associated directly or indirectly with the source code changes. TI selects these tests as part of the subset of the tests run in the pipeline. TI skips tests that aren't needed because there were no relevant code change.
- Changed tests: When a test is changed, TI selects and runs that test, even if the code the test covers hasn't changed.
- New tests: When you add a new test, TI selects and runs that test. This ensures that the test is running successfully and also finds correlations between the new test and new/existing code.
TI is always up to date and syncs when you merge code to any branch.
After a build runs, TI gives you full visibility into which tests were selected and why. This can help you identify negative trends and gain insights to improve test quality and coverage. You can find the Test results and the TI call graph visualization on the Build details page. The call graph visualization shows the changed classes and methods that caused each test to be selected.
Supported codebases
Test Intelligence supports the following codebases:
- Java
- Kotlin
- Scala
- C# (.NET Core, NUnit)
Currently, TI for .NET is behind the feature flag TI_DOTNET. Contact Harness Support to enable the feature.
For unsupported codebases, use Run steps to run tests.
Add the Run Tests step
You need a CI pipeline with a Build stage where you'll add the Run Tests step. Your pipeline must be associated with a supported codebase.
If you haven't created a pipeline before, try one of the CI pipeline tutorials or go to CI pipeline creation overview.
The build environment must have the necessary binaries for the Run Tests step to execute your test commands. Depending on the stage's build infrastructure, Run Tests steps can use binaries that exist in the build environment or pull an image, such as a public or private Docker image, that contains the required binaries. For more information about when and how to specify images, go to the Container registry and image settings.
- Visual
- YAML
Go to the Build stage in the pipeline where you want to add the Run step.
On the Execution tab, select Add Step, and select the Run Tests step from the Step Library.
Configure the Run Tests step settings. To enable Test Intelligence, you must:
- Define one or more Test Report Paths. JUnit XML format is required. For more information, go to Format test reports.
- Select Run Only Selected Tests.
- Specify the Language, Build Tool, Build Arguments, and other settings specific to your selected language or tool.
- Specify a Container Registry and Image, if required by the build infrastructure.
Select Apply Changes to save the step.
After adding the Run Tests step, make sure you generate the initial call graph.
In Harness, go to the pipeline where you want to add the
RunTestsstep. In theCIstage, add aRunTestsstep and configure the Run Tests step settings. To enable Test Intelligence, you must:- Specify one or more report paths in
reports. JUnit XML format is required. For more information, go to Format test reports. - Include
runOnlySelectedTests: true - Specify
language,buildTool,args, and other settings specific to your selected language or tool. - Include
connectorRefandimageif required by the build infrastructure.
- Specify one or more report paths in
After adding the
RunTestsstep, make sure you generate the initial call graph.
- Java and Kotlin
- Scala
- .NET Core
              - step:
                  type: RunTests
                  name: Run Tests
                  identifier: Run_Tests
                  spec:
                    connectorRef: account.harnessImage ## Specify if required by your build infrastructure.
                    image: maven:3.8-jdk-11 ## Specify if required by your build infrastructure.
                    language: Java ## Specify Java or Kotlin.
                    buildTool: Maven ## Specify Bazel, Maven, or Gradle.
                    args: test
                    packages: io.harness.
                    runOnlySelectedTests: true ## Set to false if you don't want to use TI.
                    postCommand: mvn package -DskipTests
                    reports:
                      type: JUnit
                      spec:
                        paths:
                          - "target/reports/*.xml"
              - step:
                  type: RunTests
                  name: Run Tests
                  identifier: Run_Tests
                  spec:
                    connectorRef: account.harnessImage ## Specify if required by your build infrastructure.
                    image: maven:3.8-jdk-11 ## Specify if required by your build infrastructure.
                    language: Scala
                    buildTool: Maven ## Specify Bazel, Maven, Gradle, or Sbt.
                    args: test
                    packages: io.harness.
                    runOnlySelectedTests: true ## Set to false if you don't want to use TI.
                    postCommand: mvn package -DskipTests
                    reports:
                      type: JUnit
                      spec:
                        paths:
                          - "target/reports/*.xml"
              - step:
                  type: RunTests
                  identifier: runTestsWithIntelligence
                  name: runTestsWithIntelligence
                  spec:
                    connectorRef: account.harnessImage ## Specify if required by your build infrastructure.
                    image: mcr.microsoft.com/dotnet/sdk:6.0 ## Specify if required by your build infrastructure.
                    language: Csharp
                    buildEnvironment: Core
                    frameworkVersion: "6.0"
                    buildTool: Dotnet ## Specify Dotnet or Nunit.
                    args: dotnet test --no-build --verbosity normal
                    namespaces: aw,fc
                    runOnlySelectedTests: true ## Set to false if you don't want to use TI.
                    preCommand: |-
                      dotnet tool install -g trx2junit
                      export PATH="$:/root/.dotnet/tools"
                      dotnet restore
                      dotnet build
                    postCommand: trx2junit results.trx
                    reports:
                        type: JUnit
                        spec:
                          paths:
                            - results.xml
Generate the initial call graph
The first time you enable Test Intelligence on a repo, you must run all tests to generate an initial call graph. This creates a baseline for test selection in future builds. To generate the initial call graph:
- Add a webhook trigger to the pipeline that listens for PRs to be opened against the pipeline's codebase.
- Open a PR against the pipeline's codebase. Make sure the build triggered by this PR runs all tests.
- Wait while the pipeline executes. To monitor the build's progress, go to Builds and select the build that the PR started.
- If the tests pass and the build succeeds, merge the PR.
Enable parallelism (test splitting) for Test Intelligence
You can enable parallelism and test splitting in your Run Tests steps to further optimize test times.
With parallelism, you specify how you want Harness to divide the work for a step or stage. When you use parallelism and test splitting with Test Intelligence, Harness divides the work after test selection. This means that your test execution time is reduced by both test selection and parallelism.
Example: Time saved by combining TI with test splitting
Suppose you have a pipeline that runs 100 tests, and each test takes about one second to run. Here's how TI and parallelism can reduce your test times:
- By default, without TI or parallelism, all 100 tests run in sequence, taking 100 seconds.
- With TI, test selection reduces the number of tests based on the detected changes. Supposing only 20 out of the 100 tests are required, the build with TI runs 20 tests in sequence, taking 20 seconds. This reduces test run time by 80%.
- With TI and parallelism, the selected tests are divided into a number of workloads. Supposing a maximum of four workloads and 20 selected tests, the 20 tests are split into four concurrently-running groups. It takes only five seconds to run the tests, reducing test run time by 95% compared to the default.
Note that while parallelism for TI can improve the total time it takes to run all tests, some tests may still take a long time to run if, by their nature, they are intensive, long-running tests.
To enable parallelism for TI, you must set a parallelism strategy on either the Run Tests step or the stage where you have the Run Tests step, and you must add the enableTestSplitting parameter to your Run Tests step. You can also add the optional parameter testSplitStrategy.
    - stage:
        type: CI
        identifier: Build_and_Test
        name: Build and Test
        spec:
          cloneCodebase: true
          execution:
            steps:
              - step:
                  identifier: Run_Tests_with_Intelligence
                  name: Run Tests with Intelligence
                  spec:
                    language: Java
                    buildTool: Maven
                    args: test
                    enableTestSplitting: true ## Enable test splitting.
                    testSplitStrategy: ClassTiming ## Optional. Can be ClassTiming or TestCount. Default is ClassTiming.
                    postCommand: mvn package -DskipTests
                    reports:
                      spec:
                        paths:
                          - "target/surefire-reports/*.xml"
                      type: JUnit
                    runOnlySelectedTests: true ## Enable TIe.
                  type: RunTests
          platform:
            arch: Amd64
            os: Linux
          runtime:
            spec: {}
            type: Cloud
        strategy:
          parallelism: 3 ## Set the number of groups to use for test splitting.
Go to the pipeline where you want to enable parallelism for TI.
Define the parallelism strategy on either the stage where you have the Run Tests step or on the Run Tests step itself. You must include
strategy:parallelism. Other options, such asmaxConcurrencyare optional.You can do this in either the visual or YAML editor. In the visual editor, Parallelism is found under Looping Strategy in the stage's or step's Advanced settings.
cautionIf you use step-level parallelism, you must ensure that your test runners won't interfere with each other, because all parallel steps work on the same directory.
Switch to the YAML editor, if you were not already using it.
Find the
RunTestsstep, and then find thespecsection.Add
enableTestSplitting: true.The
testSplitStrategyparameter is optional. If you include it, you can choose eitherTestCountorClassTiming.Class timing uses test times from previous runs to determine how to split the test workload for the current build. Test count uses simple division to split the tests into workloads. The default is
ClassTimingif you omit this parameter. However, the maximum possible number of workloads is determined by the parallelismstrategyyou specified on the step or stage. For example, if you setparallelism: 5, tests are split into a maximum of five workloads.
Ignore tests or files
If you want Test Intelligence to ignore certain tests or files, create a .ticonfig.yaml file in your codebase containing a list of tests and files to ignore, for example:
config:
  ignore:
    - "README.md"
    - ".ticonfig.yaml"
    - "**/*.go"
    - "**/Dockerfile*"
    - "licenses/**/*"
    - "img/**/*"
View test reports
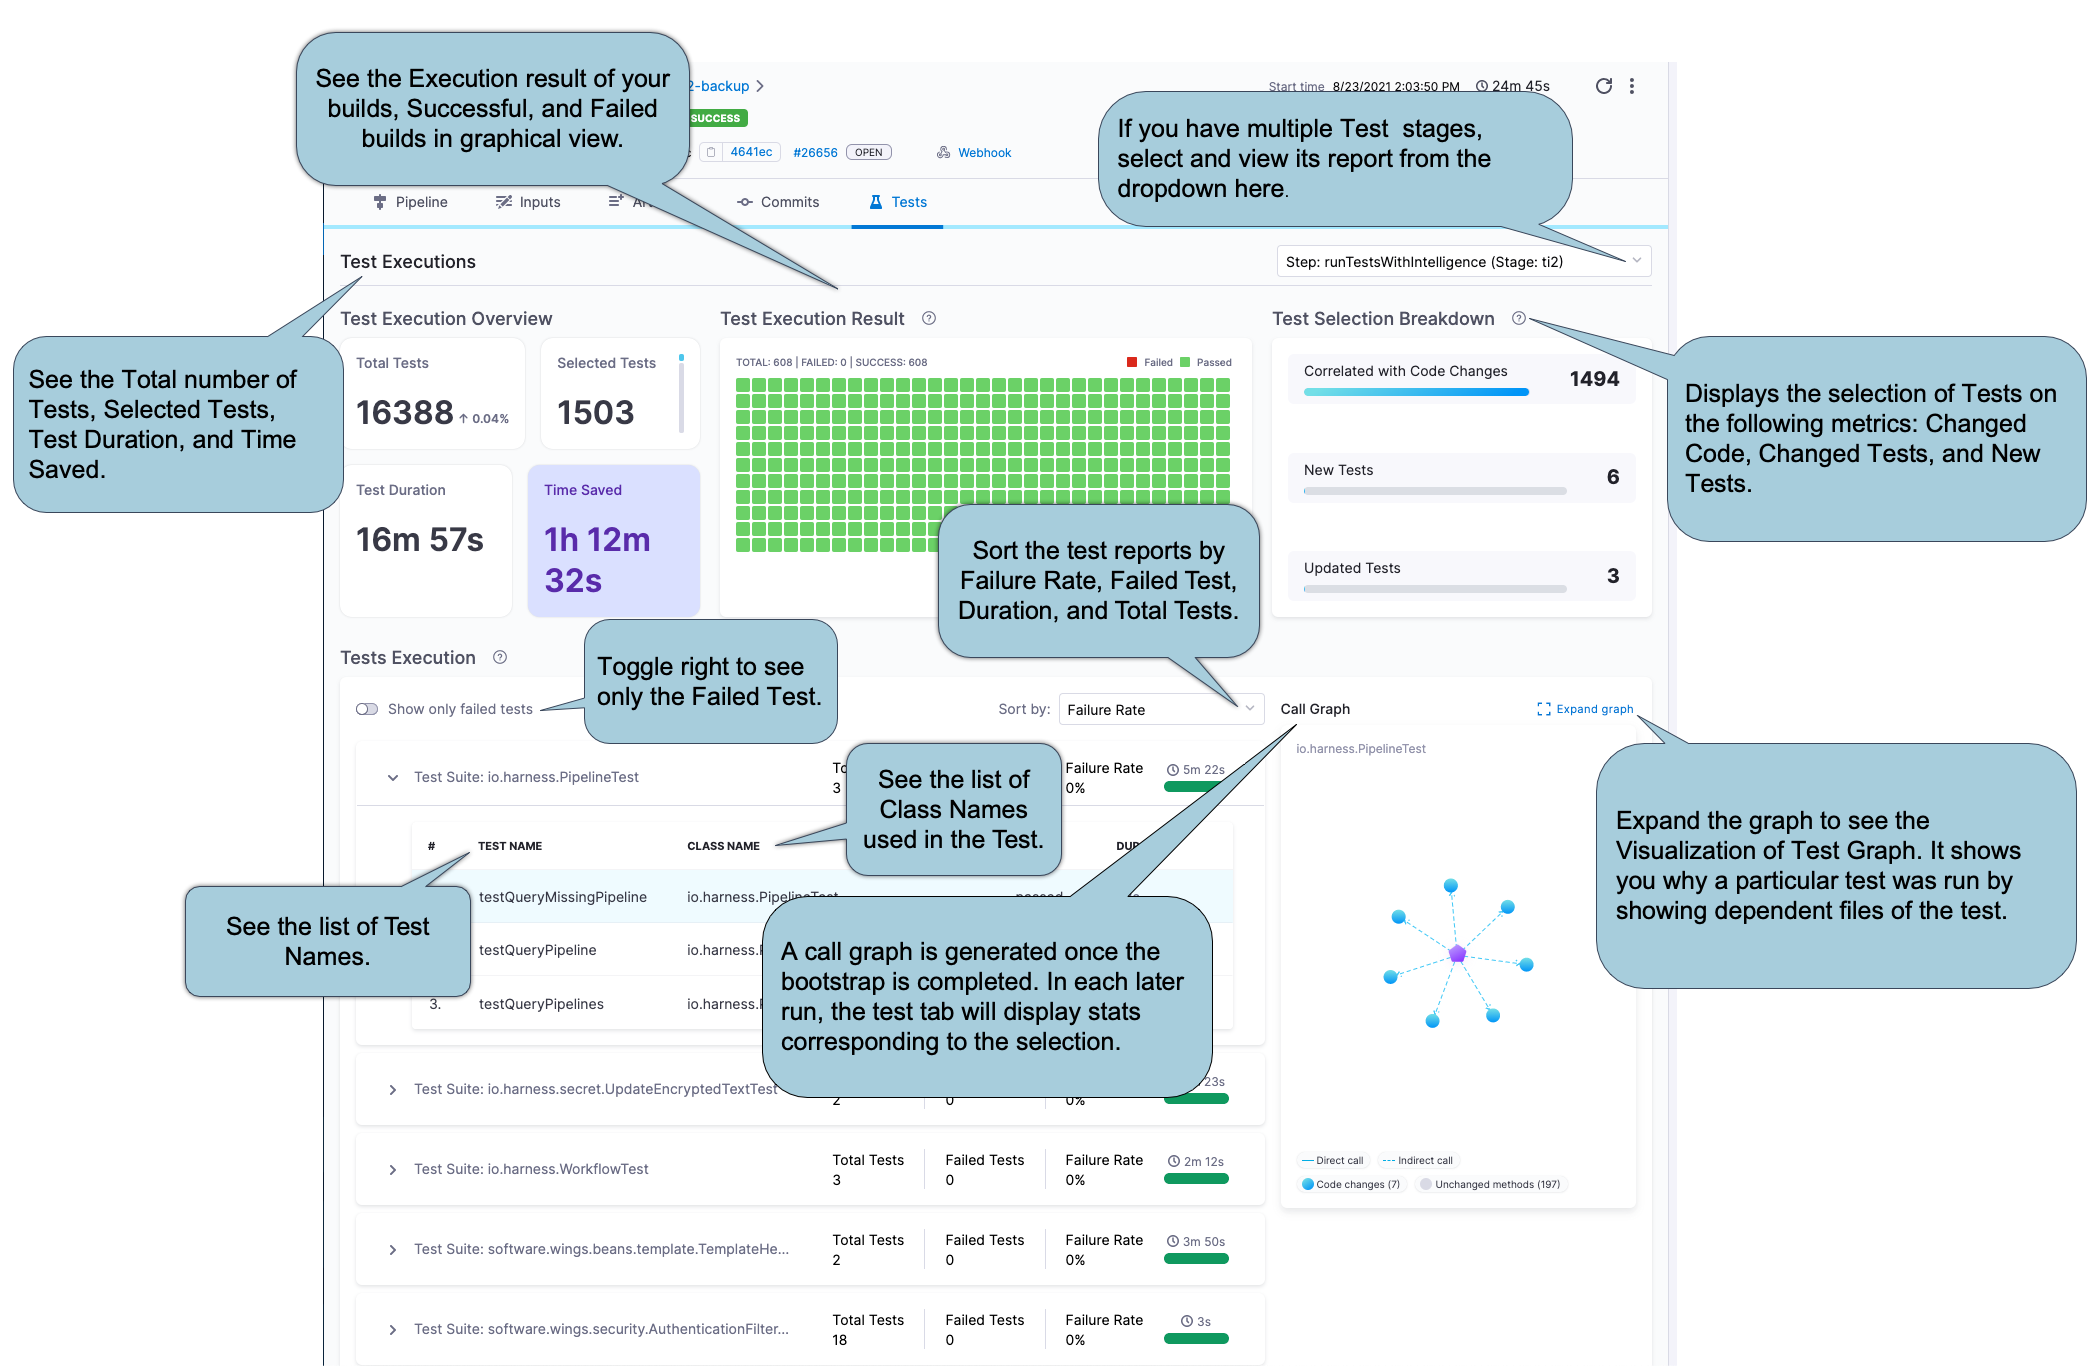
To view the test report, go to the Tests tab on the Build details page. The test report content is based on the tests you configured for the Run Tests step.
In order for the Tests tab to show tests, your test reports must be in JUnit XML format, because Harness parses test reports that are in JUnit XML format only. For more information about formatting unit test reports, go to Format test reports.
Expand the sections below to learn more about the Tests tab contents.
Test Execution Overview
This section provides an overview of Total Tests, number of Selected Tests, total Duration of all tests, and Time Saved.
Duration reflects the sum of CPU time taken for all tests to complete. The values are collected as-is from the JUnit report, and they don't correspond with wall-clock time. In contrast, the pipeline execution time is a measure of wall-clock time. Therefore, it is possible that the Duration may exceed the total pipeline execution time.
Test Execution Result
This section provides a graphical representation of successful and failed tests.
Test Selection Breakdown
Test Intelligence analyzes changes to source files and test files in the codebase and then runs only the tests that are relevant to the detected changes. This section reports how many tests ran based on the different the types of code changes included in this build:
- Correlated with Code Changes: The number of tests that ran due to changes in the codebase.
- New Tests: The number of tests that ran because they are new.
- Updated Tests: The number of tests that ran because there was a change to the actual test code or content.
Test Execution
This section provides a detailed list of all tests, including class methods and test methods.
Initially, the list shows only failed tests. To see all tests, toggle Show all Tests.
You can sort the list by failure rate, duration, and total tests. You can also expand test suites to see details about individual tests in that suite.
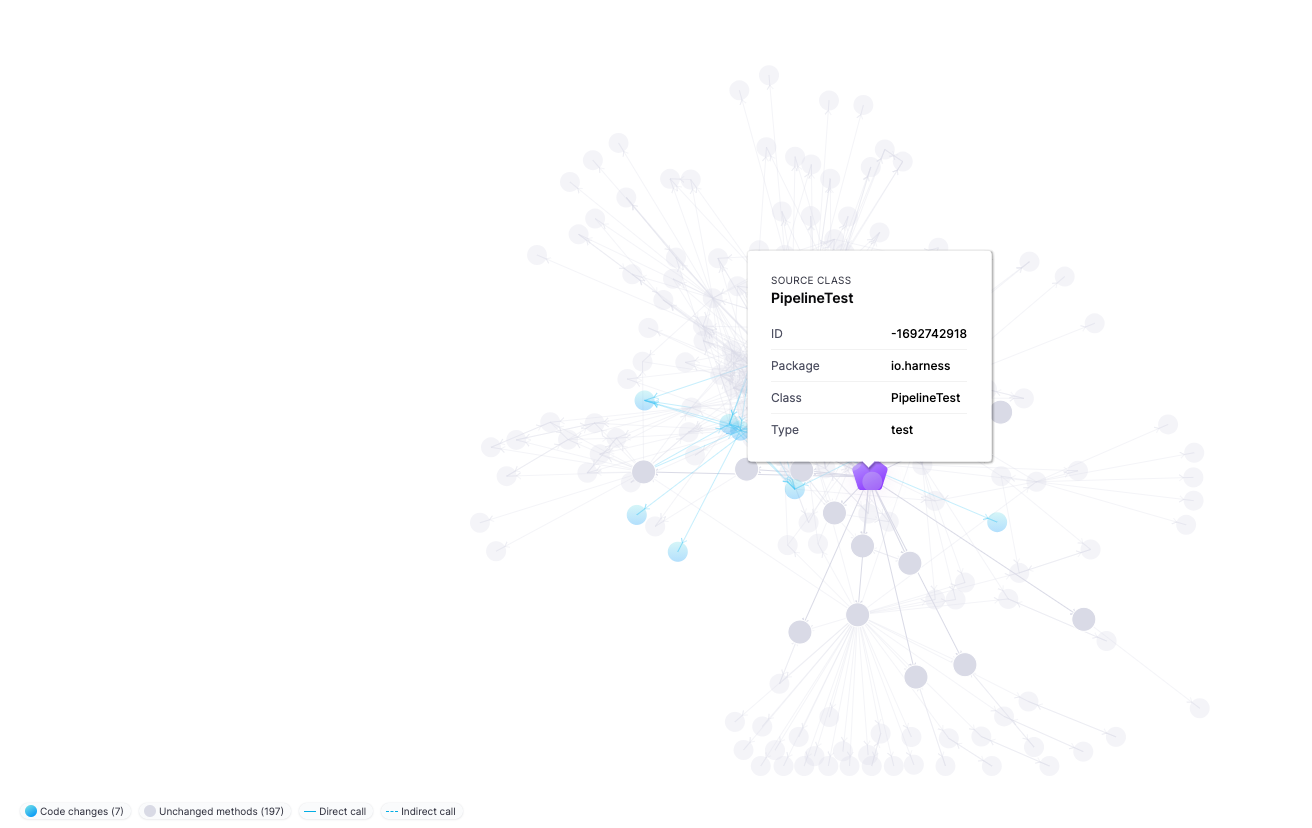
Call Graph
The first time you enable Test Intelligence on a repo, you must use a webhook-based PR trigger to run all tests and generate the initial call graph. This creates a baseline for test selection in future builds; therefore, the initial call graph is not particularly useful. In subsequent builds, the call graph shows information about tests selected by TI for that run.
Select Expand graph to view the TI Visualization, which shows why a specific test was selected and the reason behind every test selection. Purple nodes represent tests. Select any test (purple node) to see all the classes and methods covered by that test. Blue nodes represent changes to classes and methods that caused TI to select that test.
Troubleshooting
You might encounter these issues when using Test Intelligence.
pom.xml with argLine
If your pom.xml contains argLine, you must update the Java Agent as follows:
Before:
<argLine> something
</argLine>
After:
<argLine> something -javaagent:/addon/bin/java-agent.jar=/addon/tmp/config.ini
</argLine>
Jacoco/Surefire/Failsafe
If you're using Jacoco, Surefire, or Failsafe, make sure the forkCount is not set to 0.
For example, the following configuration in pom.xml removes the forkCount setting and applies useSystemClassLoader as a workaround:
<plugin>
    <groupId>org.apache.maven.plugins</groupId>
    <artifactId>maven-surefire-plugin</artifactId>
    <version>2.22.1</version>
    <configuration>
        <!--  <forkCount>0</forkCount> -->
        <useSystemClassLoader>false</useSystemClassLoader>
    </configuration>
</plugin>
Settings
The Run Tests step has the following settings.
- Some settings are located under Additional Configuration in the Pipeline Studio's visual editor.
- Some settings are only applicable to certain languages or build tools.
- Settings specific to containers, such as Set Container Resources, are not applicable when using the step in a stage with VM or Harness Cloud build infrastructure.
Name
Enter a name summarizing the step's purpose. Harness automatically assigns an Id (Entity Identifier Reference) based on the Name. You can edit the Id.
Description
Optional text string.
Container Registry and Image
The Container Registry is a Harness container registry connector for the image that you want Harness to run build commands on, such as Docker Hub.
The Image is the FQN (fully-qualified name) or artifact name of the Docker image to use when this step runs commands, for example us.gcr.io/playground-123/quickstart-image. The image name should include the tag. If you don't include a tag, Harness uses the latest tag.
You can use any Docker image from any Docker registry, including Docker images from private registries. Different container registries require different name formats:
- Docker Registry: Enter the name of the artifact you want to deploy, such as
library/tomcat. Wildcards aren't supported. FQN is required for images in private container registries. - ECR: Enter the FQN (fully-qualified name) of the artifact you want to deploy. Images in repos must reference a path, for example:
40000005317.dkr.ecr.us-east-1.amazonaws.com/todolist:0.2. - GCR: Enter the FQN (fully-qualified name) of the artifact you want to deploy. Images in repos must reference a path starting with the project ID that the artifact is in, for example:
us.gcr.io/playground-243019/quickstart-image:latest.
The stage's build infrastructure determines whether these fields are required or optional:
- Kubernetes cluster build infrastructure: Container Registry and Image are always required.
- Local runner build infrastructure: Container Registry and Image are always required.
- Self-hosted cloud provider VM build infrastructure: Run Tests steps can use binaries that you've made available on your build VMs. The Container Registry and Image are required if the VM doesn't have the necessary binaries. These fields are located under Additional Configuration for stages that use self-hosted VM build infrastructure.
- Harness Cloud build infrastructure: Run Tests steps can use binaries available on Harness Cloud machines, as described in the image specifications. The Container Registry and Image are required if the machine doesn't have the binaries you need. These fields are located under Additional Configuration for stages that use Harness Cloud build infrastructure.
Language
Select the source code language to build: C#, Java, Kotlin, or Scala.
Additional settings appear if you select C# or Java.
- C#
- Java
Build Environment
Select the build environment to test.
Framework Version
Select the framework version to test.
Namespaces
This setting is only available if you select DOTNET as the Build Tool.
Supply a comma-separated list of namespace prefixes that you want to test.
Do you want to enable Error Tracking?
Error tracking helps you be more proactive at discovering and remediating errors early in the software development lifecycle. It help s you more easily discover issues and assess the quality of code before it reaches production.
Select Yes to enable error tracking. When enabled, a set of commands are auto-populated in the Pre-Command field. Review these commends to ensure they are compatible with your build. The auto-populated commands are enclosed between #ET-SETUP-BEGIN and #ET-SETUP-END, for example:
#ET-SETUP-BEGIN
PROJ_DIR=$PWD
cd /opt
arch=`uname -m`
if [ $arch = "x86_64" ]; then
  if cat /etc/os-release | grep -iq alpine ; then
    wget -qO- https://get.et.harness.io/releases/latest/alpine/harness-et-agent.tar.gz | tar -xz
  else
    wget -qO- https://get.et.harness.io/releases/latest/nix/harness-et-agent.tar.gz | tar -xz
  fi
elif [ $arch = "aarch64" ]; then
  wget -qO- https://get.et.harness.io/releases/latest/arm/harness-et-agent.tar.gz | tar -xz
fi
export ET_COLLECTOR_URL=https://app.harness.io/<cluster_value>/et-collector
export ET_APPLICATION_NAME=$HARNESS_PIPELINE_ID
export ET_ENV_ID=_INTERNAL_ET_CI
export ET_DEPLOYMENT_NAME=$HARNESS_BUILD_ID
export ET_ACCOUNT_ID=$HARNESS_ACCOUNT_ID
export ET_ORG_ID=$HARNESS_ORG_ID
export ET_PROJECT_ID=$HARNESS_PROJECT_ID
# export ET_SHUTDOWN_GRACETIME=30000
export JAVA_TOOL_OPTIONS="-agentpath:/opt/harness/lib/libETAgent.so"
# Uncomment the line below if using Java version 10 or above
# export JAVA_TOOL_OPTIONS="-Xshare:off -XX:-UseTypeSpeculation -XX:ReservedCodeCacheSize=512m -agentpath:/opt/harness/lib/libETAgent.so"
cd $PROJ_DIR
#ET-SETUP-END
Error tracking output is reported on the Error Tracking tab when the pipeline runs.
Test Annotations
This setting is located under Additional Configuration.
You can provide a comma-separated list of test annotations used in unit testing. Any method with a specified annotation is treated as a test method. If not specified, the defaults are: org.junit.Test, org.junit.jupiter.api.Test, org.testing.annotations.Test
Build Tool
Select the build automation tool. Supported tools vary by Language.
If you use a Bazel container image in a build infrastructure where Bazel isn't already installed, your pipeline must include commands or steps to install Bazel. This is because bazel query is called before the container image is pulled.
Bazel is already installed on Harness Cloud. For other build infrastructures, you must manually confirm if Bazel is already installed.
Build Arguments
Enter the arguments for the build tool. These are used as input for the chosen build tool.
The following languages and build tools have specific build argument requirements:
- Java: Provide runtime arguments for the tests, for example:
Test -Dmaven.test.failure.ignore=true -DfailIfNoTests=false. - C#: Provide runtime arguments for the tests, for example:
/path/to/test.dll /path/to/testProject.dll. Do not inject another instrumenting agent, such as a code-coverage agent, in the argument string. - NUnit C#: Provide runtime executables and arguments for the tests, for example:
. "path/to/nunit3-console.exe" path/to/TestProject.dll --result="UnitTestResults.xml" /path/to/testProject.dll. You must include the executable in the string. Do not inject another instrumenting agent, such as a code-coverage agent, in the string.
Test Report Paths
Specify one or more paths to files that store test results in JUnit XML format. You can add multiple paths. If you specify multiple paths, make sure the files contain unique tests to avoid duplicates. Glob is supported.
This field is required for the Run Tests step to publish test results.
Pre-Command
Enter the commands for setting up the environment before running the tests. For example, printenv prints all or part of the environment.
If a script is supplied here, select the corresponding Shell option.
Post-Command
Enter the commands used for cleaning up the environment after running the tests. For example, sleep 600 suspends the process for 600 seconds.
If a script is supplied here, select the corresponding Shell option.
Run Only Selected Tests
This option must be selected (true) to enable Test Intelligence.
If this option is not selected (false), TI is disabled and all tests run on every build.
Packages
Leave blank or provide a comma-separated list of source code package prefixes, such as com.company., io.company.migrations. If you do not provide a list, Harness auto-detects the packages.
Environment Variables
Variables passed to the container as environment variables and used in the step's commands.
Output Variables
Output variables expose values for use by other steps or stages in the pipeline.
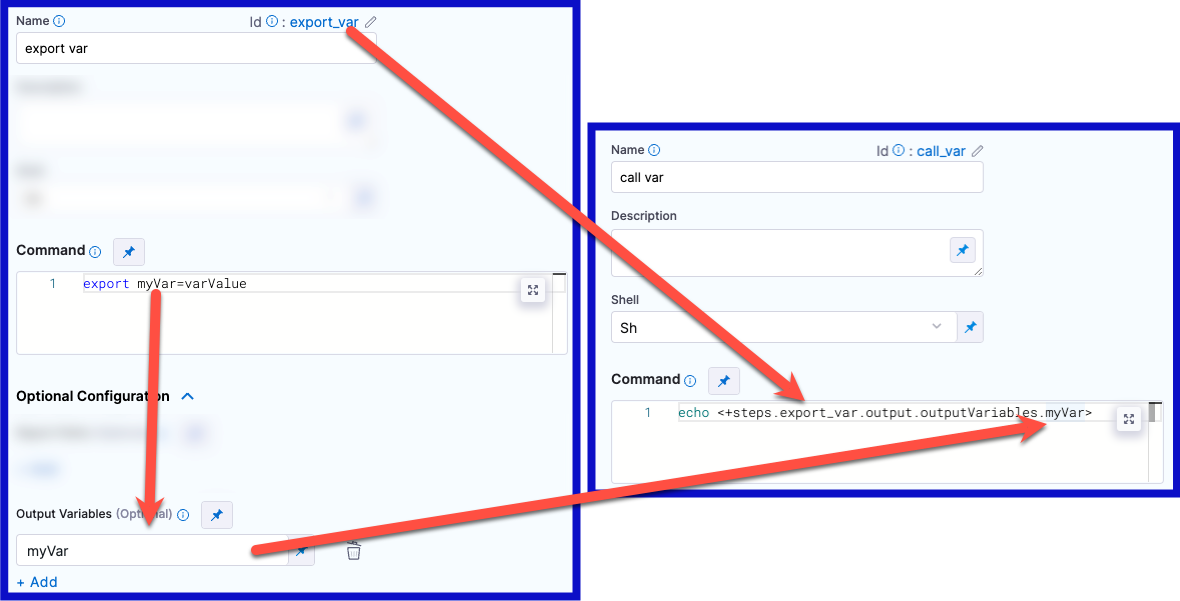
YAML example: Output variable
In the following YAML example, step alpha exports an output variable called myVar, and then step beta references that output variable.
              - step:
                  type: Run
                  name: alpha
                  identifier: alpha
                  spec:
                    shell: Sh
                    command: export myVar=varValue
                    outputVariables:
                      - name: myVar
              - step:
                  type: Run
                  name: beta
                  identifier: beta
                  spec:
                    shell: Sh
                    command: |-
                      echo <+steps.alpha.output.outputVariables.myVar>
                      echo <+execution.steps.alpha.output.outputVariables.myVar>
If an output variable value contains a secret, be aware that the secret will be visible in the build details:
- On the Output tab of the step where the output variable originates.
- In the build logs for any later steps that reference that variable.
For information about best practices for using secrets in pipelines, go to the Secrets documentation.
Create an output variable
To create an output variable, do the following in the step where the output variable originates:
In the Command field, export the output variable. For example, the following command exports a variable called
myVarwith a value ofvarValue:export myVar=varValueIn the step's Output Variables, declare the variable name, such as
myVar.
Reference an output variable
To reference an output variable in a later step or stage in the same pipeline, use a variable expression that includes the originating step's ID and the variable's name.
Use either of the following expressions to reference an output variable in another step in the same stage:
<+steps.[stepID].output.outputVariables.[varName]>
<+execution.steps.[stepID].output.outputVariables.[varName]>
Use either of the following expressions to reference an output variable in a different stage than the one where it originated:
<+stages.[stageID].spec.execution.steps.[stepID].output.outputVariables.[varName]>
<+pipeline.stages.[stageID].spec.execution.steps.[stepID].output.outputVariables.[varName]>
Early access feature: Output variables as environment variables
Currently, this early access feature is behind the feature flag CI_OUTPUT_VARIABLES_AS_ENV. Contact Harness Support to enable the feature.
With this feature flag enabled, output variables from steps are automatically available as environment variables for other steps in the same Build (CI) stage. This means that, if you have a Build stage with three steps, an output variable produced from step one is automatically available as an environment variable for steps two and three.
In other steps in the same stage, you can refer to the output variable by its key without additional identification. For example, an output variable called MY_VAR can be referenced later as simply $MY_VAR. Without this feature flag enabled, you must use an expression to reference the output variable, such as <+steps.stepID.output.outputVariables.MY_VAR>.
With or without this feature flag, you must use an expression when referencing output variables across stages, for example:
name: <+stages.[stageID].spec.execution.steps.[stepID].output.outputVariables.[varName]>
name: <+pipeline.stages.[stageID].spec.execution.steps.[stepID].output.outputVariables.[varName]>
YAML examples: Referencing output variables
In the following YAML example, a step called alpha exports an output variable called myVar, and then a step called beta references that output variable. Both steps are in the same stage.
              - step:
                  type: Run
                  name: alpha
                  identifier: alpha
                  spec:
                    shell: Sh
                    command: export myVar=varValue
                    outputVariables:
                      - name: myVar
              - step:
                  type: Run
                  name: beta
                  identifier: beta
                  spec:
                    shell: Sh
                    command: |-
                      echo $myVar
The following YAML example has two stages. In the first stage, a step called alpha exports an output variable called myVar, and then, in the second stage, a step called beta references that output variable.
    - stage:
        name: stage1
        identifier: stage1
        type: CI
        spec:
          ...
          execution:
            steps:
              - step:
                  type: Run
                  name: alpha
                  identifier: alpha
                  spec:
                    shell: Sh
                    command: export myVar=varValue
                    outputVariables:
                      - name: myVar
    - stage:
        name: stage2
        identifier: stage2
        type: CI
        spec:
          ...
          execution:
            steps:
              - step:
                  type: Run
                  name: beta
                  identifier: beta
                  spec:
                    shell: Sh
                    command: |-
                      echo <+stages.stage1.spec.execution.steps.alpha.output.outputVariables.myVar>
If multiple variables have the same name, variables are chosen according to the following hierarchy:
- Environment variables defined in the current step
- Output variables from previous steps
- Stage variables
- Pipeline variables
This means that Harness looks for the referenced variable within the current step, then it looks at previous steps in the same stage, and then checks the stage variables, and, finally, it checks the pipeline variables. It stops when it finds a match.
If multiple output variables from previous steps have the same name, the last-produced variable takes priority. For example, assume a stage has three steps, and steps one and two both produce output variables called NAME. If step three calls NAME, the value of NAME from step two is pulled into step three because that is last-produced instance of the NAME variable.
For stages that use looping strategies, particularly parallelism, the last-produced instance of a variable can differ between runs. Depending on how quickly the parallel steps execute during each run, the last step to finish might not always be the same.
To avoid conflicts with same-name variables, either make sure your variables have unique names or use an expression to specify a particular instance of a variable, for example:
name: <+steps.stepID.output.outputVariables.MY_VAR>
name: <+execution.steps.stepGroupID.steps.stepID.output.outputVariables.MY_VAR>
YAML examples: Variables with the same name
In the following YAML example, step alpha and zeta both export output variables called myVar. When the last step, beta, references myVar, it gets the value assigned in zeta because that was the most recent instance of myVar.
              - step:
                  type: Run
                  name: alpha
                  identifier: alpha
                  spec:
                    shell: Sh
                    command: export myVar=varValue1
                    outputVariables:
                      - name: myVar
              - step:
                  type: Run
                  name: zeta
                  identifier: zeta
                  spec:
                    shell: Sh
                    command: export myVar=varValue2
                    outputVariables:
                      - name: myVar
              - step:
                  type: Run
                  name: beta
                  identifier: beta
                  spec:
                    shell: Sh
                    command: |-
                      echo $myVar
The following YAML example is the same as the previous example except that step beta uses an expression to call the value of myVar from step alpha.
              - step:
                  type: Run
                  name: alpha
                  identifier: alpha
                  spec:
                    shell: Sh
                    command: export myVar=varValue1
                    outputVariables:
                      - name: myVar
              - step:
                  type: Run
                  name: zeta
                  identifier: zeta
                  spec:
                    shell: Sh
                    command: export myVar=varValue2
                    outputVariables:
                      - name: myVar
              - step:
                  type: Run
                  name: beta
                  identifier: beta
                  spec:
                    shell: Sh
                    command: |-
                      echo <+steps.alpha.output.outputVariables.myVar>
Image Pull Policy
If you specified a Container Registry and Image, you can specify an image pull policy:
- Always: The kubelet queries the container image registry to resolve the name to an image digest every time the kubelet launches a container. If the kubelet encounters an exact digest cached locally, it uses its cached image; otherwise, the kubelet downloads (pulls) the image with the resolved digest, and uses that image to launch the container.
- If Not Present: The image is pulled only if it isn't already present locally.
- Never: The image is not pulled.
Run as User
If you specified a Container Registry and Image, you can specify the user ID to use for running processes in containerized steps.
For a Kubernetes cluster build infrastructure, the step uses this user ID to run all processes in the pod. For more information, go to Set the security context for a pod.
Set Container Resources
These settings specify the maximum resources used by the container at runtime:
- Limit Memory: The maximum memory that the container can use. You can express memory as a plain integer or as a fixed-point number using the suffixes
GorM. You can also use the power-of-two equivalentsGiandMi. The default is500Mi. - Limit CPU: The maximum number of cores that the container can use. CPU limits are measured in CPU units. Fractional requests are allowed. For example, you can specify one hundred millicpu as
0.1or100m. The default is400m. For more information go to Resource units in Kubernetes.
Timeout
The timeout limit for the step. Once the timeout is reached, the step fails and pipeline execution continues.
To change what happens when steps fail, go to Step Failure Strategy settings.
To configure when pipelines should skip certain steps, go to Step Skip Condition settings.
Pipeline YAML examples
- Harness Cloud
- Self-hosted
These examples use Harness Cloud build infrastructure.
- Java and Kotlin
- Scala
- .NET Core
This example shows a pipeline that runs tests with Maven and Test Intelligence.
pipeline:
  name: Test Intelligence Demo
  identifier: testintelligencedemo
  projectIdentifier: default
  orgIdentifier: default
  properties:
    ci:
      codebase:
        build: <+input>
        connectorRef: YOUR_CODEBASE_CONNECTOR_ID
  stages:
    - stage:
        type: CI
        identifier: Build_and_Test
        name: Build and Test
        spec:
          cloneCodebase: true
          execution:
            steps:
              - step:
                  type: RunTests
                  name: Run Tests
                  identifier: Run_Tests
                  spec:
                    language: Java ## Specify Java or Kotlin.
                    buildTool: Maven ## Specify Bazel, Maven, or Gradle.
                    args: test
                    packages: io.harness.
                    runOnlySelectedTests: true ## Set to false if you don't want to use TI.
                    postCommand: mvn package -DskipTests
                    reports:
                      type: JUnit
                      spec:
                        paths:
                          - "target/reports/*.xml"
          platform:
            arch: Amd64
            os: Linux
          runtime:
            spec: {}
            type: Cloud
This example shows a pipeline that runs tests with Maven and Test Intelligence.
pipeline:
  name: Test Intelligence Demo
  identifier: testintelligencedemo
  projectIdentifier: default
  orgIdentifier: default
  properties:
    ci:
      codebase:
        build: <+input>
        connectorRef: YOUR_CODEBASE_CONNECTOR_ID
  stages:
    - stage:
        type: CI
        identifier: Build_and_Test
        name: Build and Test
        spec:
          cloneCodebase: true
          execution:
            steps:
              - step:
                  type: RunTests
                  name: Run Tests
                  identifier: Run_Tests
                  spec:
                    language: Scala
                    buildTool: Maven ## Specify Bazel, Maven, Gradle, or Sbt.
                    args: test
                    packages: io.harness.
                    runOnlySelectedTests: true ## Set to false if you don't want to use TI.
                    postCommand: mvn package -DskipTests
                    reports:
                      type: JUnit
                      spec:
                        paths:
                          - "target/reports/*.xml"
          platform:
            arch: Amd64
            os: Linux
          runtime:
            spec: {}
            type: Cloud
This example shows a pipeline that runs tests with .NET Core and Test Intelligence.
pipeline:
  name: Test Intelligence Demo
  identifier: testintelligencedemo
  projectIdentifier: default
  orgIdentifier: default
  properties:
    ci:
      codebase:
        build: <+input>
        connectorRef: YOUR_CODEBASE_CONNECTOR_ID
  stages:
    - stage:
        type: CI
        identifier: Build_and_Test
        name: Build and Test
        spec:
          cloneCodebase: true
          execution:
            steps:
              - step:
                  type: RunTests
                  identifier: runTestsWithIntelligence
                  name: runTestsWithIntelligence
                  spec:
                    language: Csharp
                    buildEnvironment: Core
                    frameworkVersion: "6.0"
                    buildTool: Dotnet ## Specify Dotnet or Nunit.
                    args: dotnet test --no-build --verbosity normal
                    namespaces: aw,fc
                    runOnlySelectedTests: true ## Set to false if you don't want to use TI.
                    preCommand: |-
                      dotnet tool install -g trx2junit
                      export PATH="$:/root/.dotnet/tools"
                      dotnet restore
                      dotnet build
                    postCommand: trx2junit results.trx
                    reports:
                        type: JUnit
                        spec:
                          paths:
                            - results.xml
          platform:
            arch: Amd64
            os: Linux
          runtime:
            spec: {}
            type: Cloud
These examples use a Kubernetes cluster build infrastructure.
- Java and Kotlin
- Scala
- .NET Core
This example shows a pipeline that runs tests with Maven and Test Intelligence.
pipeline:
  name: Test Intelligence Demo
  identifier: testintelligencedemo
  projectIdentifier: default
  orgIdentifier: default
  properties:
    ci:
      codebase:
        build: <+input>
        connectorRef: YOUR_CODEBASE_CONNECTOR_ID
  stages:
    - stage:
        type: CI
        identifier: Build_and_Test
        name: Build and Test
        spec:
          cloneCodebase: true
          execution:
            steps:
              - step:
                  type: RunTests
                  name: Run Tests
                  identifier: Run_Tests
                  spec:
                    connectorRef: account.harnessImage ## Specify if required by your build infrastructure.
                    image: maven:3.8-jdk-11 ## Specify if required by your build infrastructure.
                    language: Java ## Specify Java or Kotlin.
                    buildTool: Maven ## Specify Bazel, Maven, or Gradle.
                    args: test
                    packages: io.harness.
                    runOnlySelectedTests: true ## Set to false if you don't want to use TI.
                    postCommand: mvn package -DskipTests
                    reports:
                      type: JUnit
                      spec:
                        paths:
                          - "target/reports/*.xml"
          infrastructure:
            type: KubernetesDirect
            spec:
              connectorRef: YOUR_KUBERNETES_CLUSTER_CONNECTOR_ID
              namespace: YOUR_KUBERNETES_NAMESPACE
              automountServiceAccountToken: true
              nodeSelector: {}
              os: Linux
This example shows a pipeline that runs tests with Maven and Test Intelligence.
pipeline:
  name: Test Intelligence Demo
  identifier: testintelligencedemo
  projectIdentifier: default
  orgIdentifier: default
  properties:
    ci:
      codebase:
        build: <+input>
        connectorRef: YOUR_CODEBASE_CONNECTOR_ID
  stages:
    - stage:
        type: CI
        identifier: Build_and_Test
        name: Build and Test
        spec:
          cloneCodebase: true
          execution:
            steps:
              - step:
                  type: RunTests
                  name: Run Tests
                  identifier: Run_Tests
                  spec:
                    connectorRef: account.harnessImage ## Specify if required by your build infrastructure.
                    image: maven:3.8-jdk-11 ## Specify if required by your build infrastructure.
                    language: Scala
                    buildTool: Maven ## Specify Bazel, Maven, Gradle, or Sbt.
                    args: test
                    packages: io.harness.
                    runOnlySelectedTests: true ## Set to false if you don't want to use TI.
                    postCommand: mvn package -DskipTests
                    reports:
                      type: JUnit
                      spec:
                        paths:
                          - "target/reports/*.xml"
          infrastructure:
            type: KubernetesDirect
            spec:
              connectorRef: YOUR_KUBERNETES_CLUSTER_CONNECTOR_ID
              namespace: YOUR_KUBERNETES_NAMESPACE
              automountServiceAccountToken: true
              nodeSelector: {}
              os: Linux
This example shows a pipeline that runs tests with .NET Core and Test Intelligence.
pipeline:
  name: Test Intelligence Demo
  identifier: testintelligencedemo
  projectIdentifier: default
  orgIdentifier: default
  properties:
    ci:
      codebase:
        build: <+input>
        connectorRef: YOUR_CODEBASE_CONNECTOR_ID
  stages:
    - stage:
        type: CI
        identifier: Build_and_Test
        name: Build and Test
        spec:
          cloneCodebase: true
          execution:
            steps:
              - step:
                  type: RunTests
                  identifier: runTestsWithIntelligence
                  name: runTestsWithIntelligence
                  spec:
                    connectorRef: account.harnessImage ## Specify if required by your build infrastructure.
                    image: mcr.microsoft.com/dotnet/sdk:6.0 ## Specify if required by your build infrastructure.
                    language: Csharp
                    buildEnvironment: Core
                    frameworkVersion: "6.0"
                    buildTool: Dotnet ## Specify Dotnet or Nunit.
                    args: dotnet test --no-build --verbosity normal
                    namespaces: aw,fc
                    runOnlySelectedTests: true ## Set to false if you don't want to use TI.
                    preCommand: |-
                      dotnet tool install -g trx2junit
                      export PATH="$:/root/.dotnet/tools"
                      dotnet restore
                      dotnet build
                    postCommand: trx2junit results.trx
                    reports:
                        type: JUnit
                        spec:
                          paths:
                            - results.xml
          infrastructure:
            type: KubernetesDirect
            spec:
              connectorRef: YOUR_KUBERNETES_CLUSTER_CONNECTOR_ID
              namespace: YOUR_KUBERNETES_NAMESPACE
              automountServiceAccountToken: true
              nodeSelector: {}
              os: Linux