Monitor Applications 24/7 with Datadog Logging
Harness 24/7 Service Guard monitors your live applications, catching problems that surface minutes or hours following deployment. For more information, see 24/7 Service Guard Overview.
You can add your Datadog monitoring to Harness 24/7 Service Guard in your Harness Application Environment. For a setup overview, see Connect to Datadog.
This section assumes you have a Harness Application set up and containing a Service and Environment. For steps on setting up a Harness Application, see Application Checklist.
Before You Begin
- See the Datadog Verification Overview.
- Make sure you Connect to Datadog.
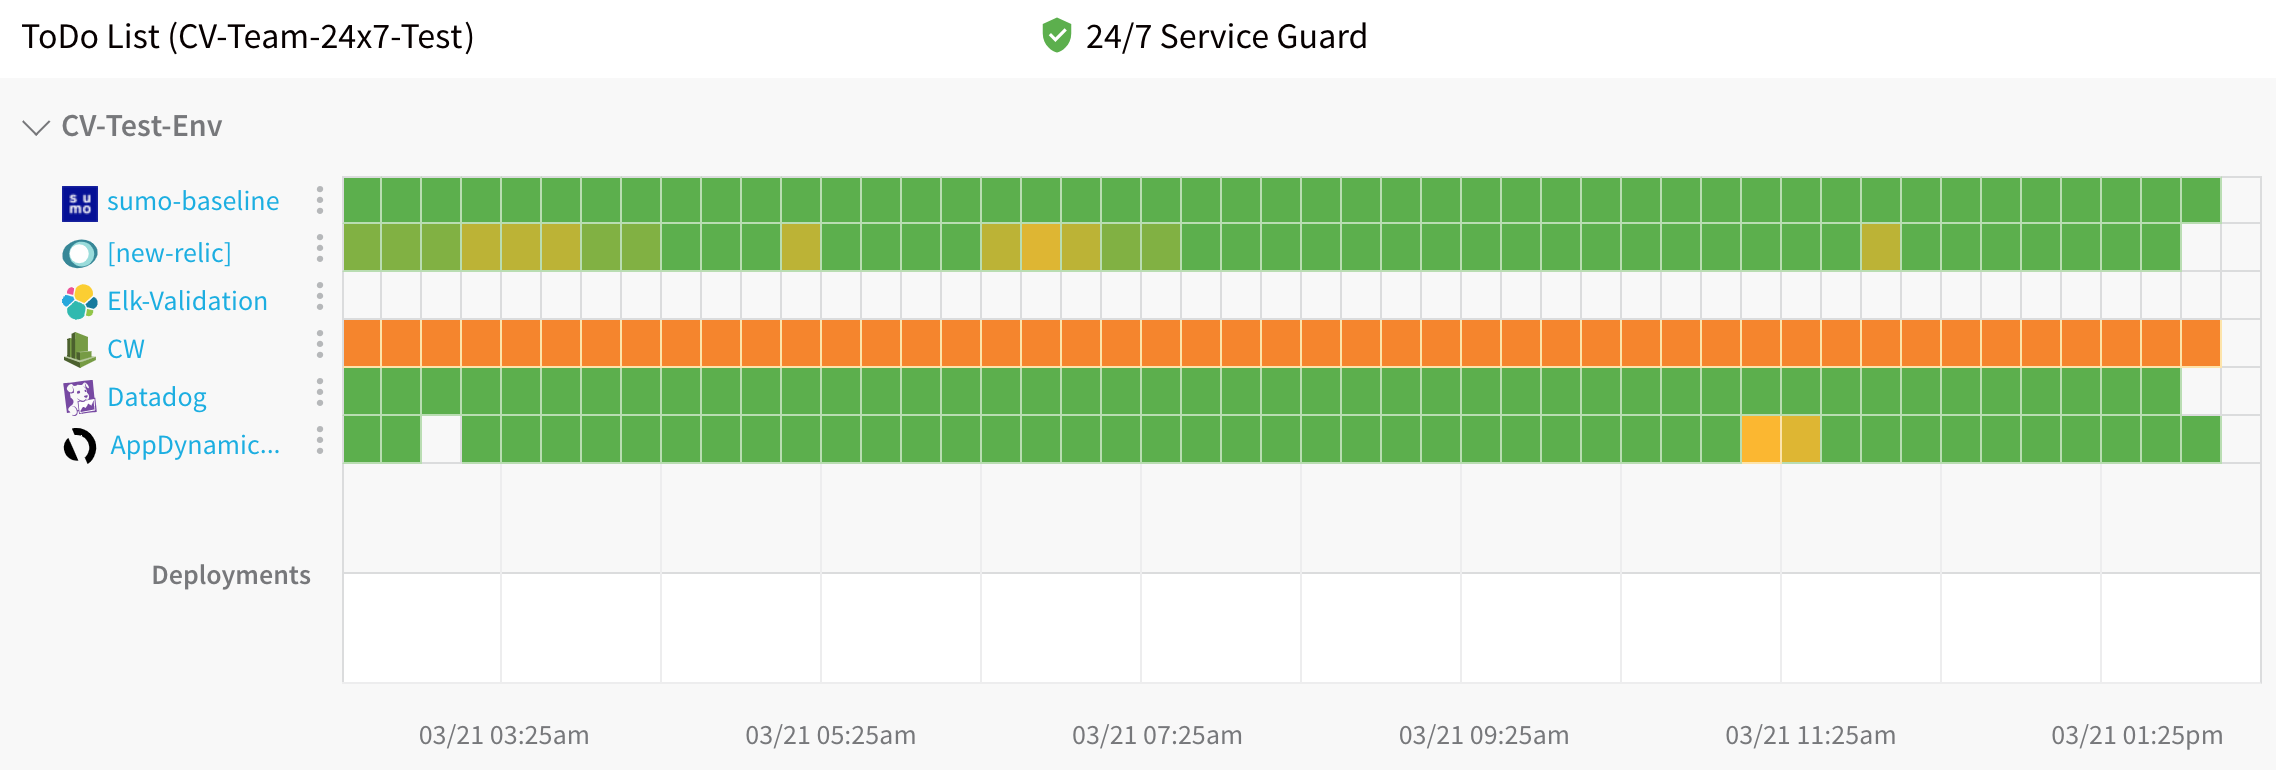
Visual Summary
Here's an example of a Datadog Logging setup for 24/7 Service Guard setup.
Step 1: Set Up 24/7 Service Guard
To set up 24/7 Service Guard for Datadog, do the following:
- Ensure that you have added Datadog as a Harness Verification Provider, as described in Verification Provider Setup.
- In your Harness Application, ensure that you have added a Service, as described in Services. For 24/7 Service Guard, you do not need to add an Artifact Source to the Service, or configure its settings. You simply need to create a Service and name it. It will represent your application for 24/7 Service Guard.
- In your Harness Application, click Environments.
- In Environments, ensure that you have added an Environment for the Service you added. For steps on adding an Environment, see Environments.
- Click the Environment for your Service. Typically, the Environment Type is Production.
- In the Environment page, locate 24/7 Service Guard.
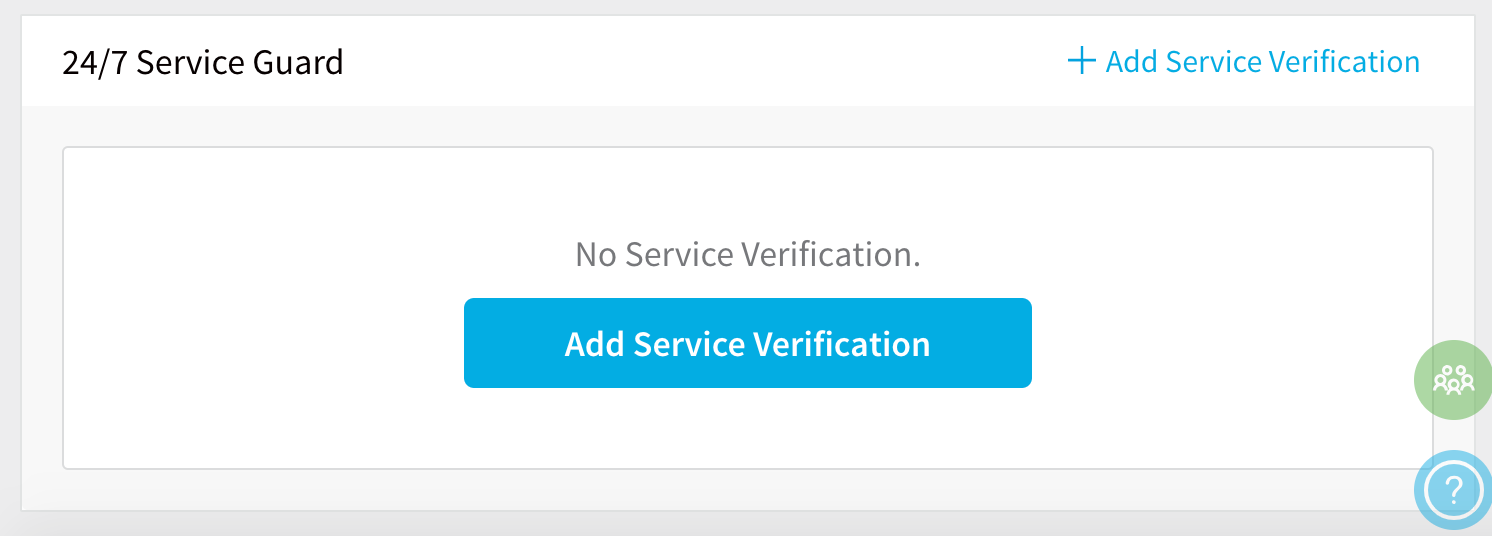
- In 24/7 Service Guard, click Add Service Verification, and then click Datadog. The Datadog dialog appears.
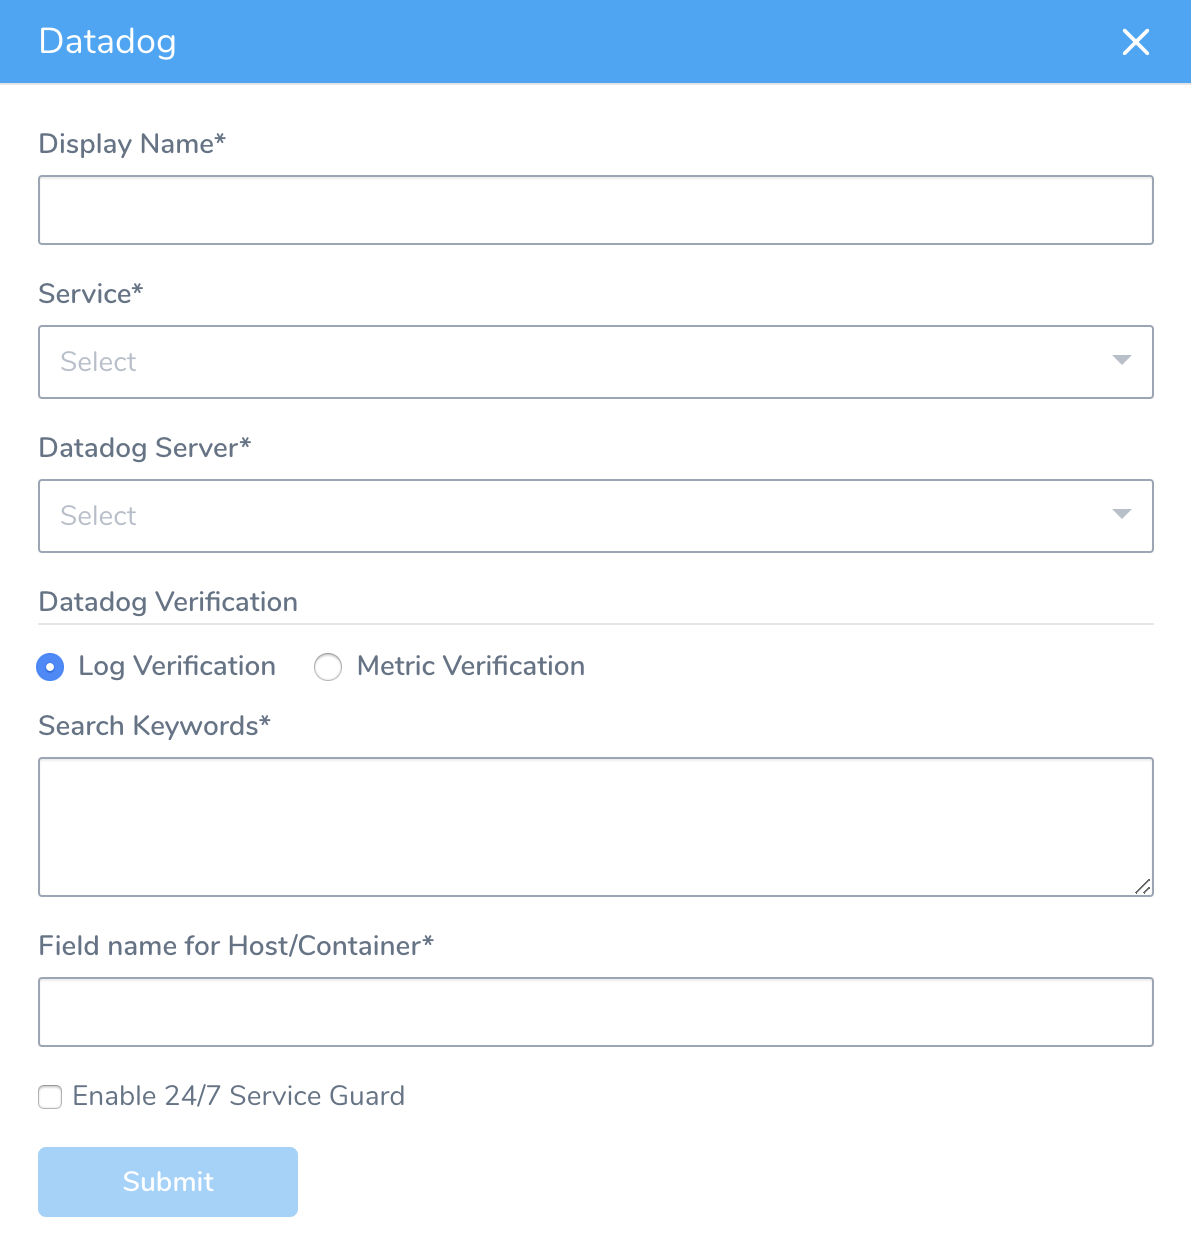
Step 2: Display Name
The name that will identify this service on the Continuous Verification dashboard. Use a name that indicates the environment and monitoring tool, such as Datadog.
Step 3: Service
The Harness Service to monitor with 24/7 Service Guard.
Step 4: Datadog Server
Select the Datadog Verification Provider to use.
Step 5: Log Verification
Select the Log Verification option.
Step 6: Search Keywords
Enter search keywords, such as *expression*. Separate keywords using spaces. (Follow the Datadog log search syntax.)
You can also enter variable expressions, such as:
error OR ${serviceVariable.error_type}
Step 7: Field Name for Host/Containers
Enter the log field that contains the name of the host/container for which you want logs. You can enter a field name for example.
Harness uses this field to group data and perform analysis at the container-level.
Step 8: Enable 24/7 Service Guard
Enable this setting to turn on 24/7 Service Guard. If you simply want to set up 24/7 Service Guard, but not enable it, leave this setting disabled.
Step 9: Verify your Settings
Click Test. Harness verifies the settings you entered.
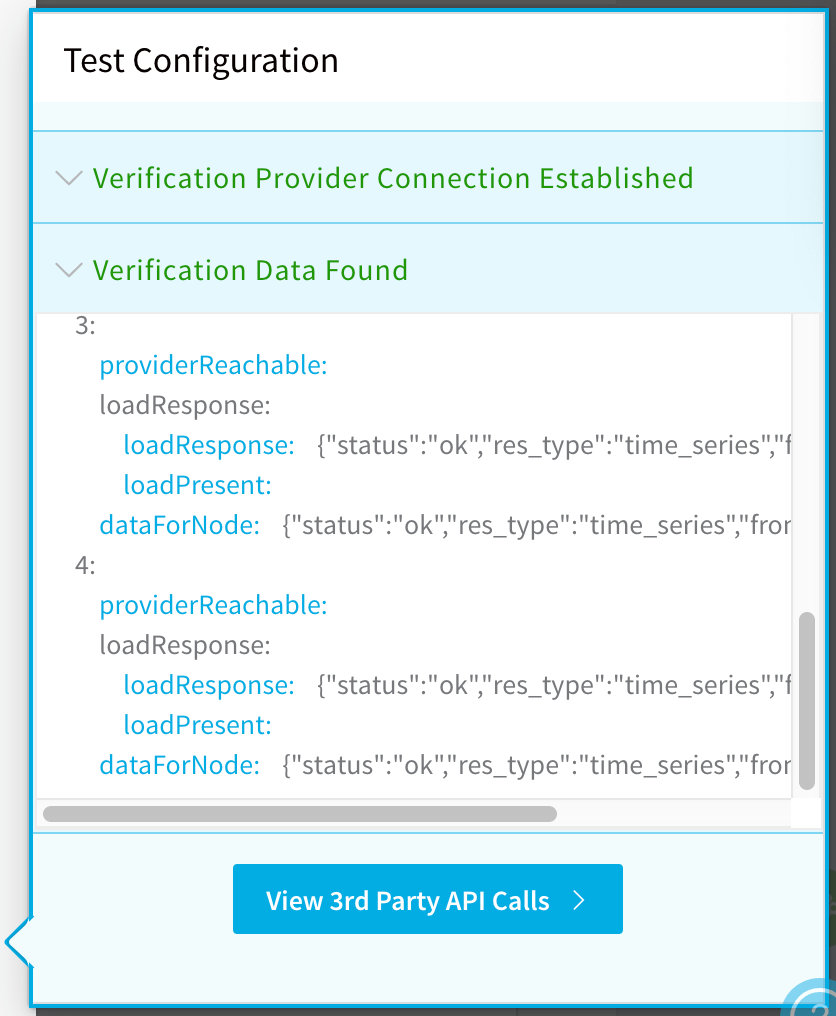
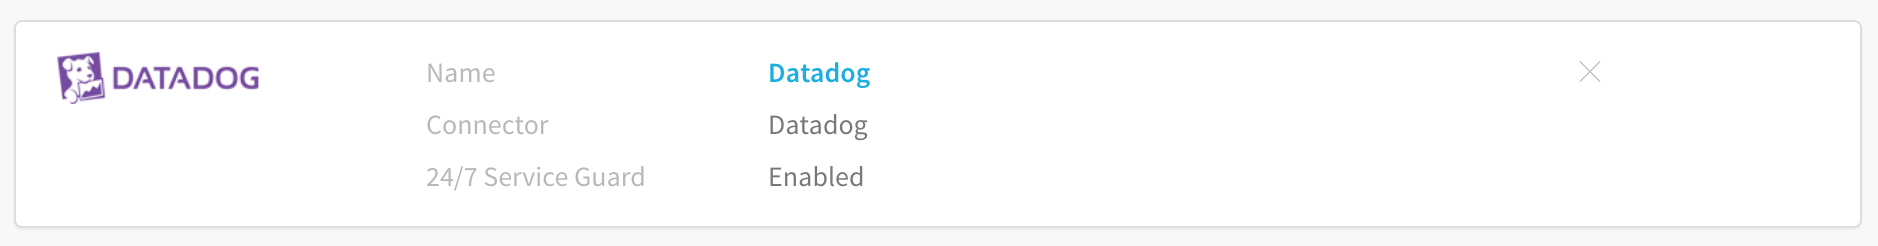
Click Submit. The Datadog 24/7 Service Guard is added.
 To see the running 24/7 Service Guard analysis, click Continuous Verification.
The 24/7 Service Guard dashboard displays the production verification results.
 For more information, see 24/7 Service Guard Overview.