Monitor Applications 24/7 with Dynatrace
Harness 24/7 Service Guard monitors your live applications, catching problems that surface minutes or hours following deployment. For more information, see 24/7 Service Guard Overview.
You can add your Dynatrace monitoring to Harness 24/7 Service Guard in your Harness Application Environment. For a setup overview, see Connect to Dynatrace.
This section assumes you have a Harness Application set up and containing a Service and Environment. For steps on setting up a Harness Application, see Application Checklist.
Before You Begin
- See the Dynatrace Verification Overview.
- See Connect to Dynatrace.
Step 1: Set up 24/7 Service Guard for Dynatrace
To set up 24/7 Service Guard for Dynatrace, do the following:
Ensure that you have added Dynatrace as a Harness Verification Provider, as described in Verification Provider Setup.
In your Harness Application, ensure that you have added a Service, as described in Services. For 24/7 Service Guard, you do not need to add an Artifact Source to the Service, or configure its settings. You simply need to create a Service and name it. It will represent your application for 24/7 Service Guard.
In your Harness Application, click Environments.
In Environments, ensure that you have added an Environment for the Service you added. For steps on adding an Environment, see Environments.
Click the Environment for your Service. Typically, the Environment Type is Production.
In the Environment page, locate 24/7 Service Guard.
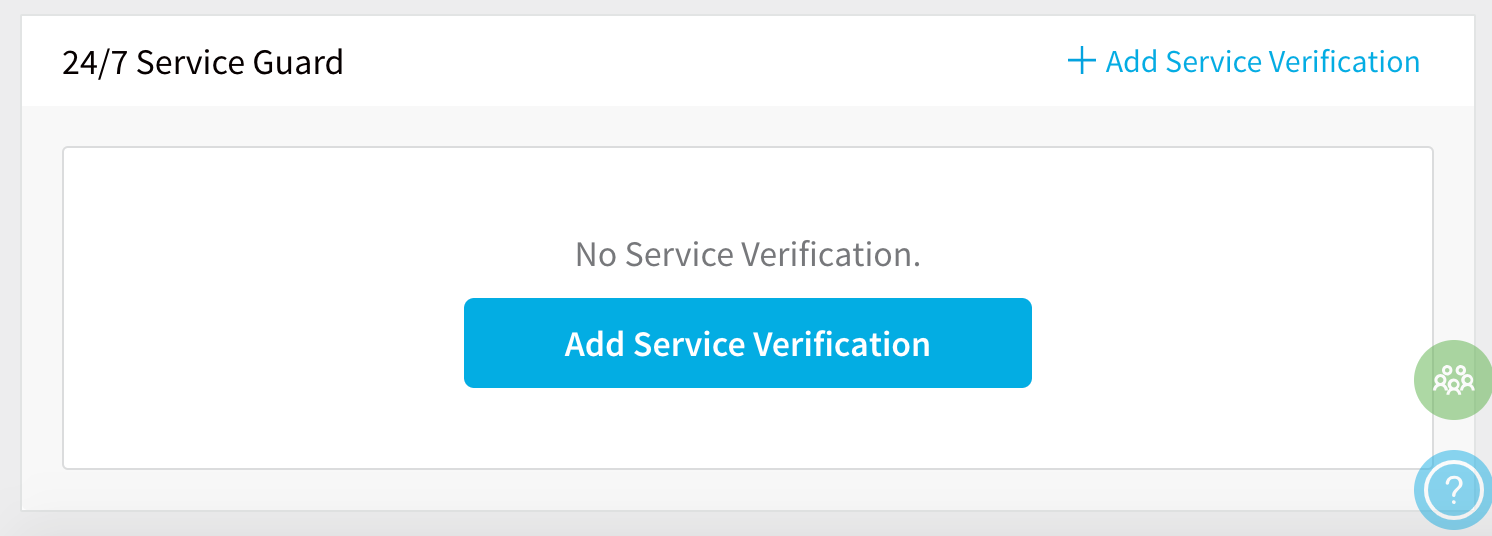
In 24/7 Service Guard, click Add Service Verification, and then click Dynatrace. The Dynatrace dialog appears.
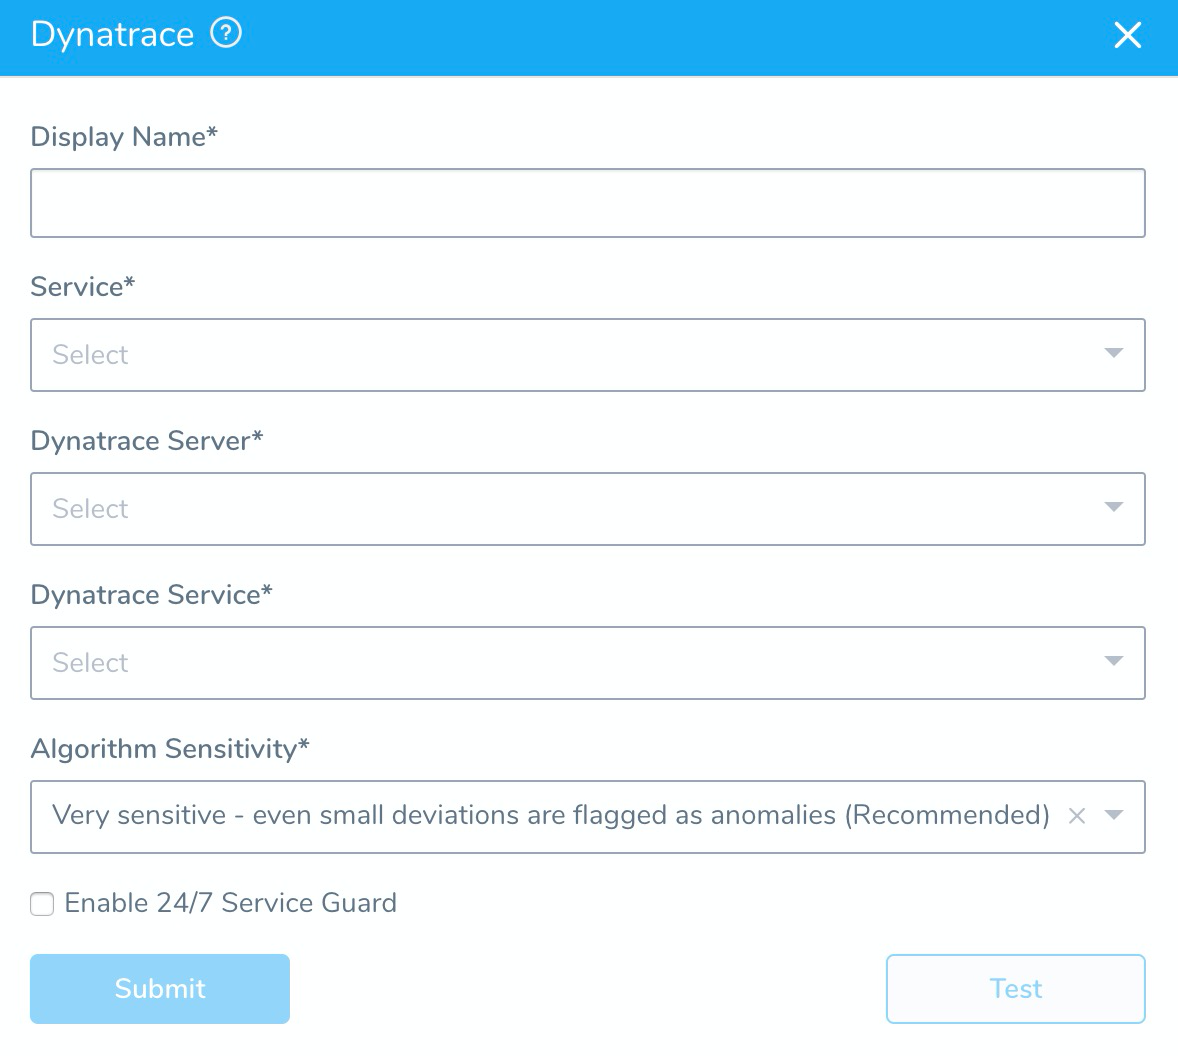
Fill out the settings.
Dynatrace returns API data for transactions that are marked as key requests only. To use these transactions in Harness, be sure to mark them as key requests in Dynatrace.
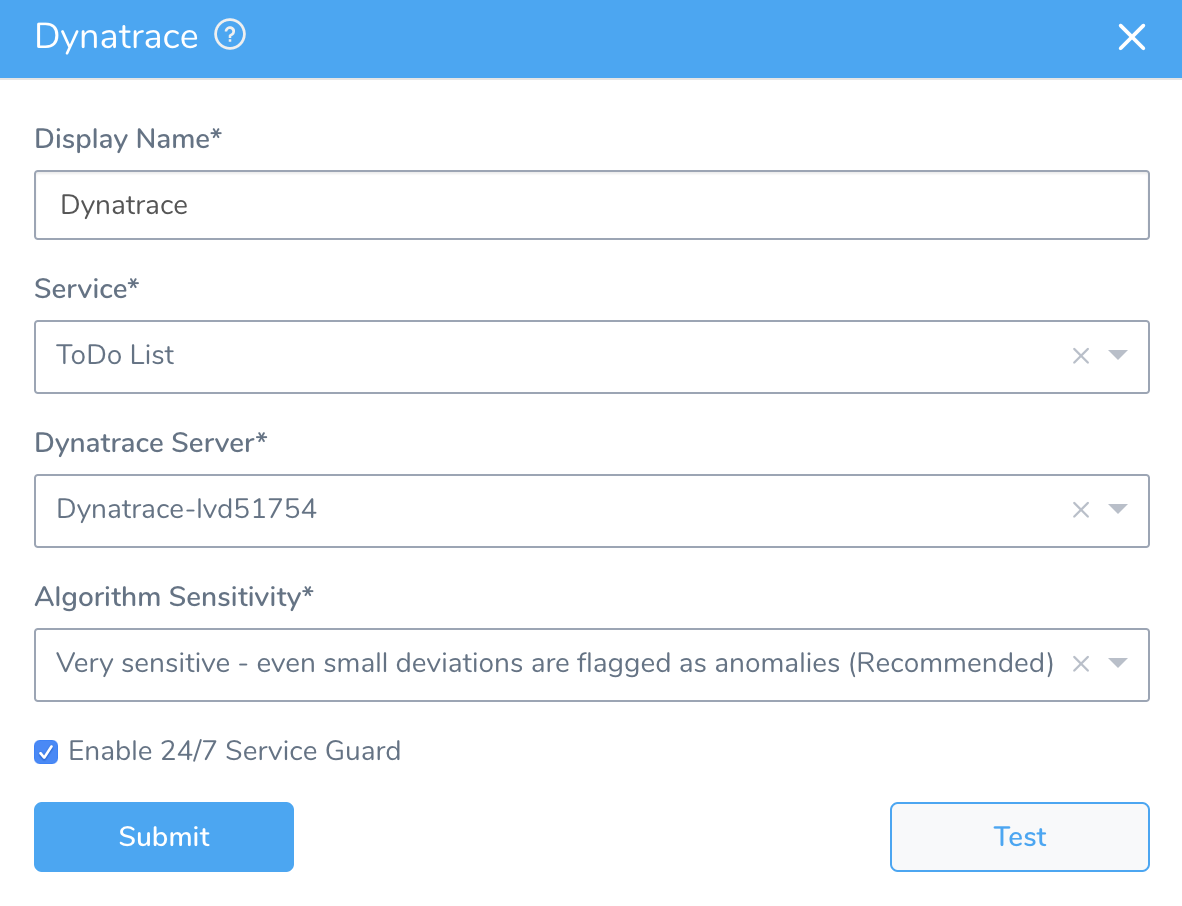
Step 2: Display Name
The name that will identify this service on the Continuous Verification dashboard. Use a name that indicates the environment and monitoring tool, such as Dynatrace.
Step 3: Service
The Harness Service to monitor with 24/7 Service Guard.
Step 4: Dynatrace Server
This dropdown contains the names of the Dynatrace verification providers you added, as described above.
Select the name of the Dynatrace verification provider that monitors the application defined in the Harness Service you selected in Service.
Step 5: Dynatrace Service
Once you select a Dynatrace server in Dynatrace Server, Harness goes and fetches a list of all the services you have in Dynatrace.
Select the Dynatrace service to monitor. Dynatrace analytics are performed at Dynatrace's service level.
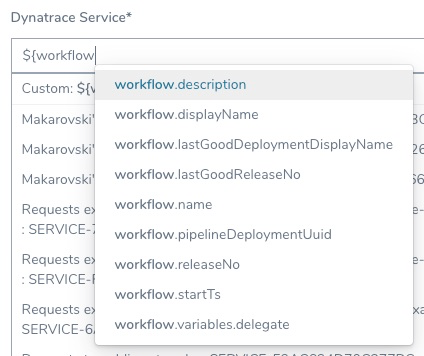
You can also enter a built-in Harness variable expression or custom variable, such as a Service or Workflow variable:
If you see multiple services for the same application, it is likely because the service is being hit from multiple endpoints.
This is uncommon in production, but in development/test environments you might be throwing traffic and data at the service from multiple endpoints (local, QA, etc). These endpoints get registered as different services by Dynatrace.
To distinguish services, Harness list the service ID also.
This ID is taken from the Dynatrace console URL (id=<service_ID>). if you need to select a specific service, use the ID in the URL to match the service listed in the Harness Dynatrace Service setting.
Step 6: Algorithm Sensitiivty
See CV Strategies, Tuning, and Best Practices.
Step 7: Enable 24/7 Service Guard
Enable this setting to turn on 24/7 Service Guard. If you simply want to set up 24/7 Service Guard, but not enable it, leave this setting disabled.
When you are finished, the dialog will look something like this:
Step 8: Verify Your Settings
Click Test. Harness verifies the settings you entered.
Harness will filter by the service you selected in Dynatrace Service. You can see this in the Third-Party API Call History.
Click Submit. The Dynatrace 24/7 Service Guard is added.

To see the running 24/7 Service Guard analysis, click Continuous Verification.
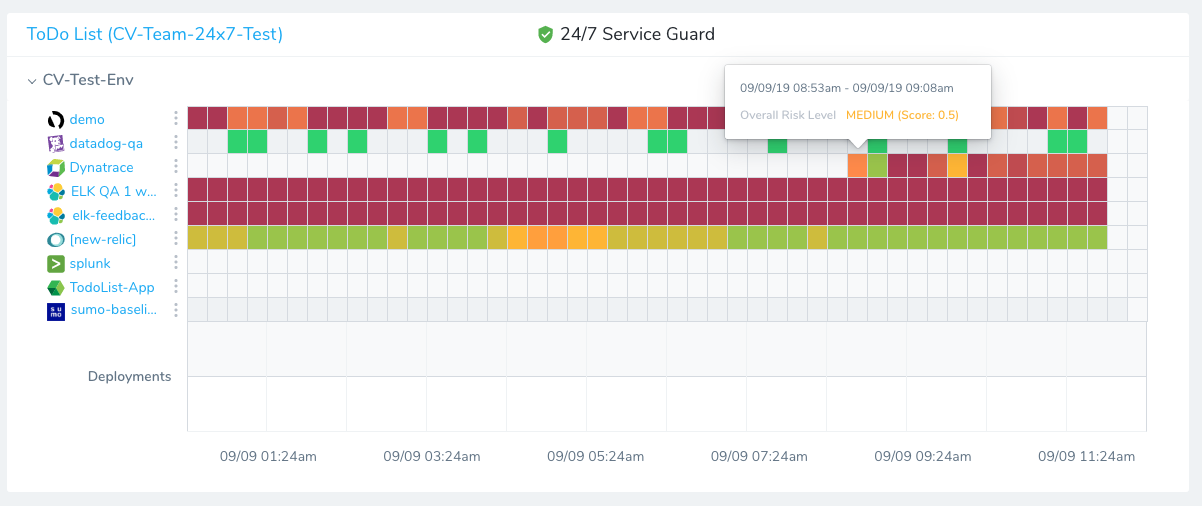
The 24/7 Service Guard dashboard displays the production verification results.
