Verify Deployments with Elasticsearch (FirstGen)
Harness can analyze Elasticsearch data to verify, rollback, and improve deployments. To apply this analysis to your deployments, you set up ELK as a verification step in a Harness Workflow. This section covers setup steps, and provides a summary of Harness verification results.
In order to obtain the names of the host(s), pod(s), or container(s) where your service is deployed, the verification provider should be added to your workflow after you have run at least one successful deployment.
Before You Begin
- See the Elasticsearch Verification Overview.
Visual Summary
Here's an example configuration of Elasticsearch deployment verification.
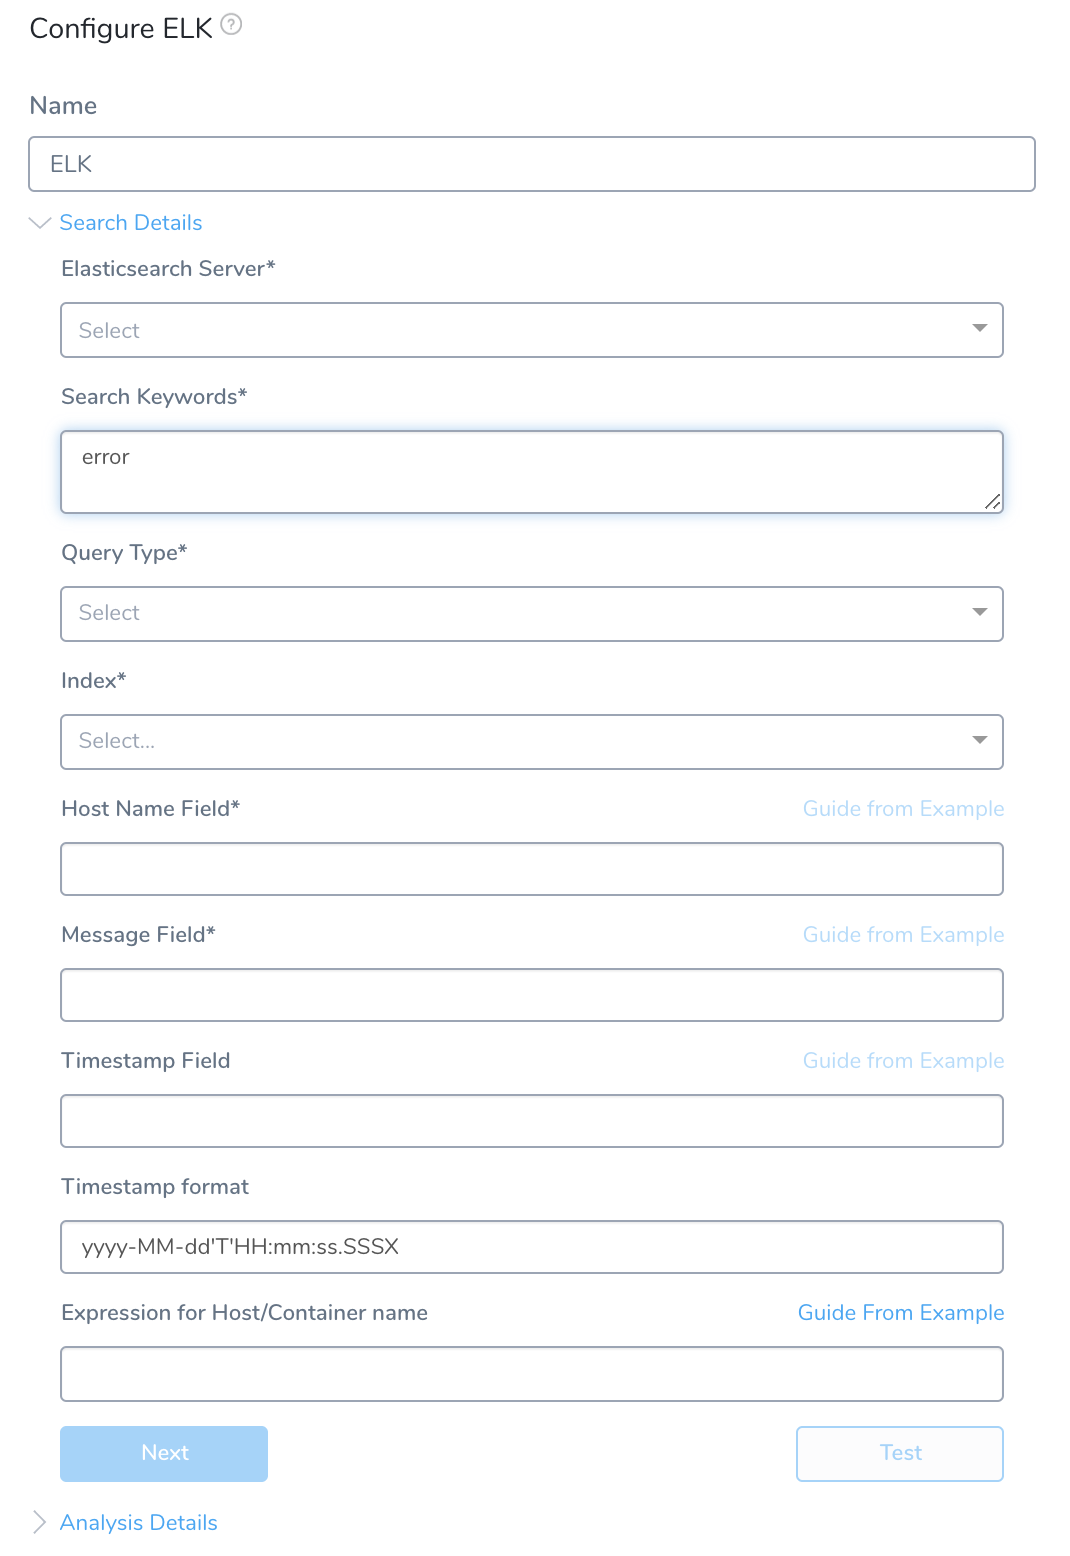
Step 1: Set Up the Deployment Verification
To add an ELK verification step to your Workflow:
- Ensure that you have added ELK Elasticsearch as a Verification Provider, as described in Verification Provider Setup.
- In your Workflow, under Verify Service, click Add Verification.
- In the resulting Add Step settings, select Log Analysis > ELK.
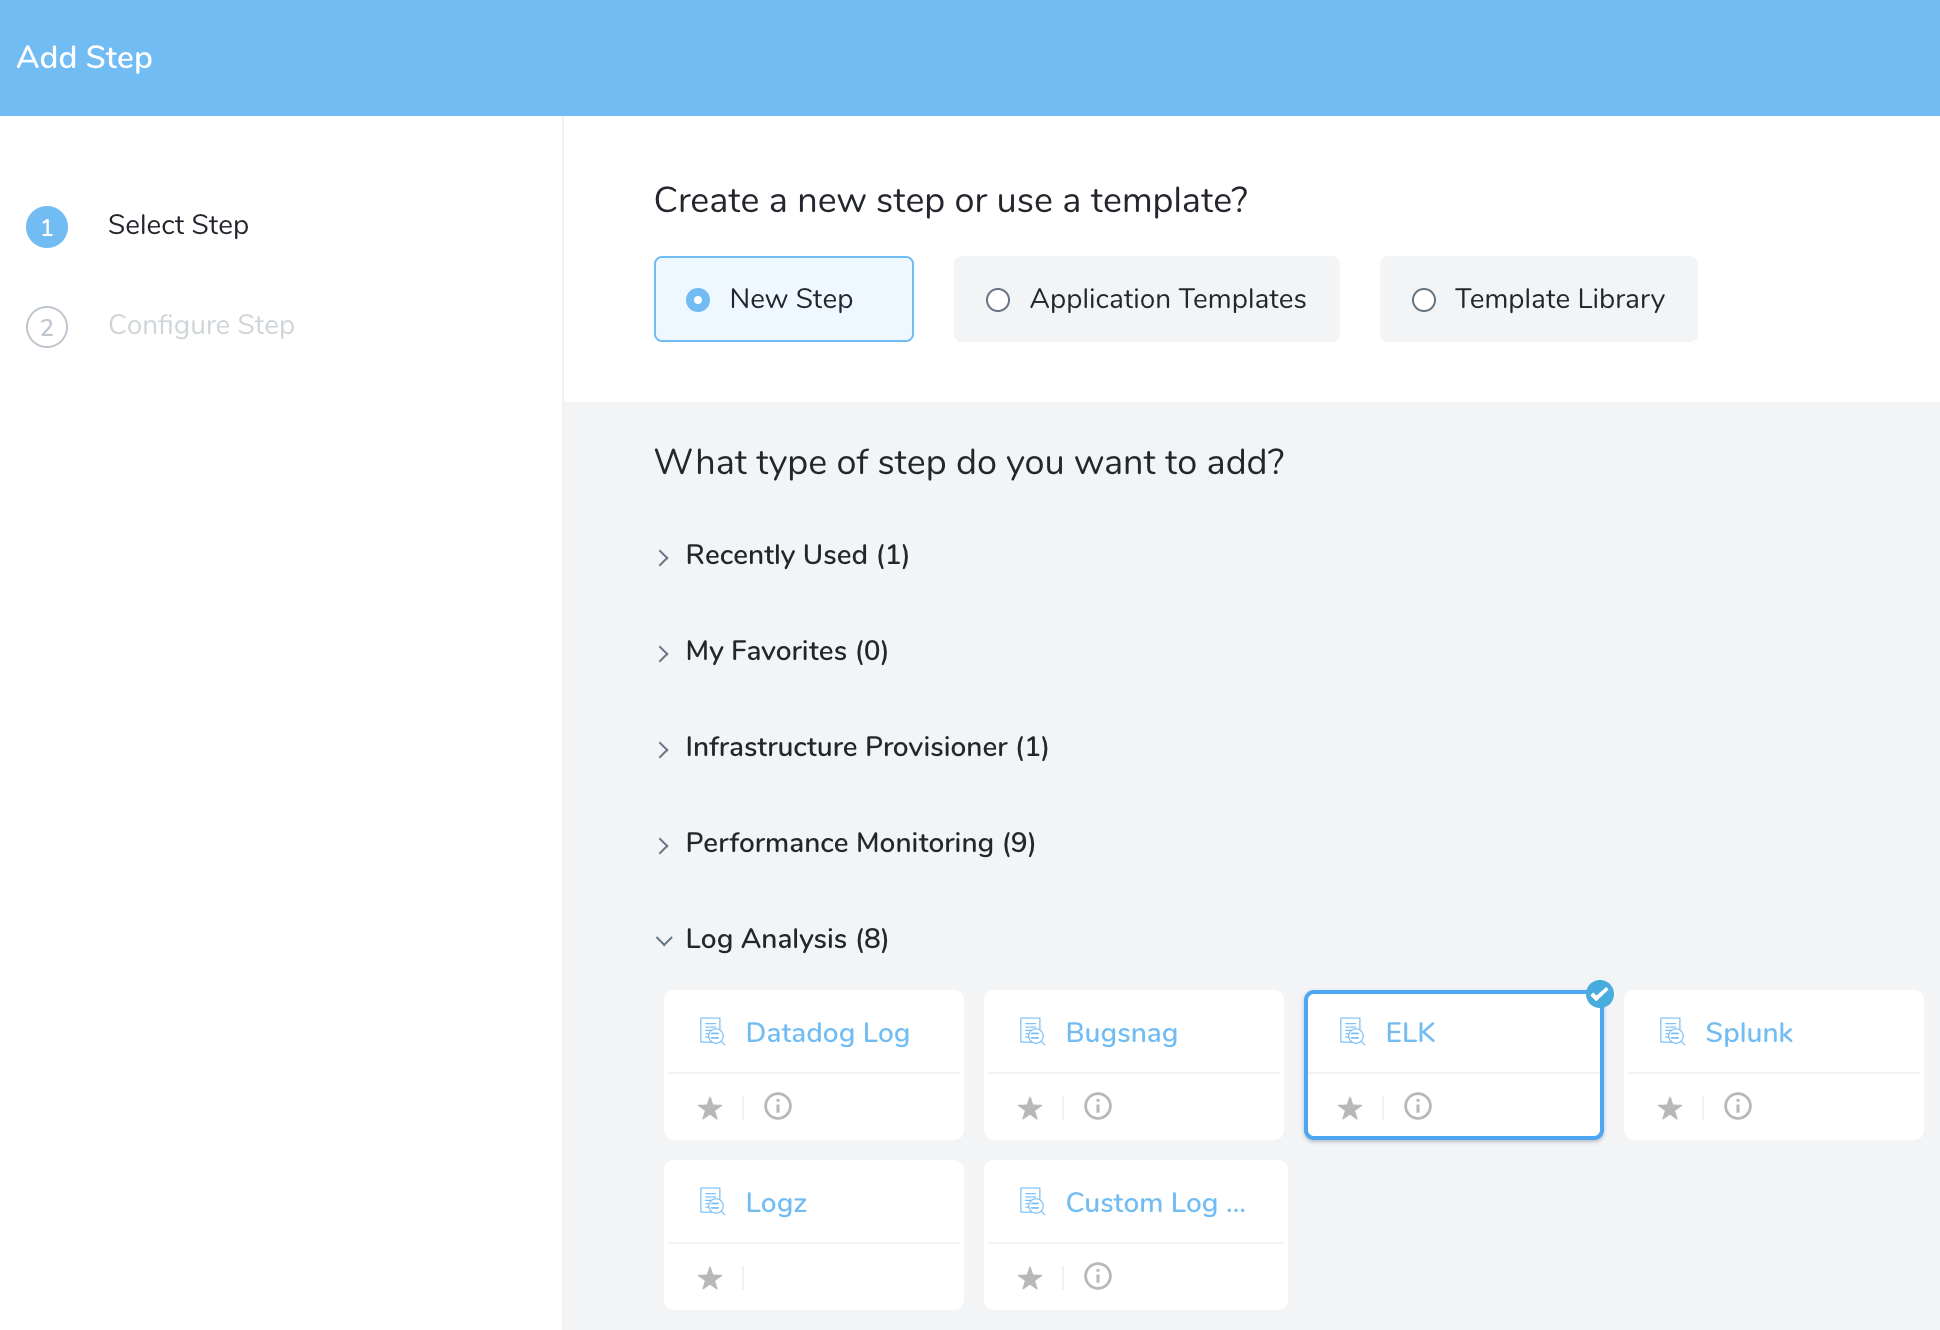
- Click Next. The Configure ELK settings appear.

Step 2: Elasticsearch Server
Select the server you added when you set up the ELK verification provider earlier in Connect to Elasticsearch.
You can also enter variable expressions, such as: ${serviceVariable.elk_connector_name}.
If the Elasticsearch Server field contains an expression, the Index field must also use an expression.
Step 3: Search Keywords
Enter search keywords for your query, such as error or exception.
The keywords are searched against the logs identified in the Message field of the dialog (see below).
You can also enter variable expressions, such as: error OR ${serviceVariable.error_type}
For an advanced query, enter an Elasticsearch JSON query. You can use JSON to create complex queries beyond keywords. The following example looks for the substring error in the field log:
{"regexp":{"log": {"value":"error"}}}
Do not use wildcards in queries for Elasticsearch. ElasticSearch documentation indicates that wildcard queries can become very expensive on the resources and take down the cluster.
Step 4: Query Type
Select query type for the value entered in the Host Name Field. The queries accept text, numerics, and dates. For MATCH and MATCH_PHRASE types, the input is analyzed and the query is constructed.
- TERM finds documents that contain the exact term specified in the entered value. See ELK documentation on TERM queries for more information.
- MATCH_PHRASE finds documents that contain the terms specified in the exact order of entries in the analyzed text. See ELK documentation on MATCH_PHRASE queries for more information.
- MATCH finds documents that contain the entries in the analyzed text in any order. See ELK documentation on MATCH queries for more information.
Step 5: Index
Enter the the index to search. This field is automatically populated from the index templates, if available.
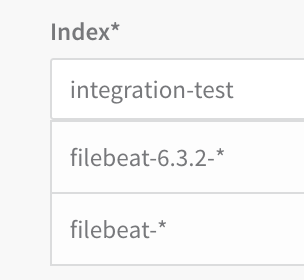
You can also enter variable expressions, such as: ${service.name}
If the Elasticsearch Server field contains an expression, the Index field must also use an expression.If there are no index templates, or if you do not have administrator privileges with ELK, enter the index manually:
- To locate indices, in Kibana, click Management.
- Click Index Patterns. The Index Patterns page appears.
- Copy the name of one of the Index patterns.
- In Harness, in the ELK dialog, paste the name of the Index pattern into Indices.
Step 6: Host Name Field
Enter the field name used in the ELK logs that refers to the host/pod/container ELK is monitoring.
Select Key from Example
To find the hostname in Kibana and enter it in Harness, do the following:
- In Kibana, click Discover.
- In the search field, search for error or exception.
- In the results, locate the host name of the host/container/pod where ELK is monitoring. For example, when using Kubernetes, the pod name field kubernetes.pod_name is used.
- In Harness, in the ELK dialog, next to Host Name Field, click Guide From Example. The Host Name Field popover appears.
- In the JSON response, click on the name of the label that maps to the host/container/pod in your log search results. Using our Kubernetes example, under pod, you would click the first name label.
The Host Name Field is filled with the JSON label for the hostname.
Paste Custom JSON Response
If you do not want to get the sample record from the server configuration and select the required object, you can use your own JSON object.
Click Paste Custom JSON Response and paste your custom valid JSON object in the text field. It will appear in the dialog and you can select to use it.
Make sure the styling of the JSON object is valid as the input field strictly validates the entry.
Step 7: Message Field
Enter the field by which the messages are usually indexed. This is typically a log field. You can also enter variable expressions, such as: ${serviceVariable.message_field}.
To find the field in Kibana and enter it in Harness, do the following:
- In Kibana, click Discover.
- In the search field, search for error or exception.
- In the results, locate a log for the host/container/pod ELK is monitoring. For example, in the following Kubernetes results in Kibana, the messages are indexed under the log field.
- In Harness, in the ELK dialog, next to Message Field, click Guide From Example. The Message Field popover appears.
- In the JSON response, click on the name of the label that maps to the log in your Kibana results. Using our Kubernetes example, you would click the log label.
The label is added to the Message Field.
You can also paste your own JSON object by clicking Paste Custom JSON Response.
Step 8: Expression for Host/Container name
Add an expression that evaluates to the host name value for the field you entered in the Host Name Field above. The default expression is ${instance.host.hostName}.
In order to obtain the names of the host where your service is deployed, the verification provider should be added to your workflow after you have run at least one successful deployment.To ensure that you pick the right field when using Guide From Example, you can use a host name from the ELK log messages as a guide.
For AWS EC2 hostnames, use the expression ${instance.hostName}.To use Guide From Example for a host name expression, do the following:
- In Kibana, click Discover.
- In the search field, search for error or exception.
- In the results, locate the name of the host/container/pod ELK is monitoring. For example, when using Kubernetes, the pod name field kubernetes.pod_name displays the value you need.
The expression that you provide in Expression for Host/Container Name should evaluate to the name here, although the suffixes can differ. - In Harness, in your workflow ELK dialog, click Guide From Example. The Expression for Host Name popover appears.
The dialog shows the service, environment, and service infrastructure used for this workflow. - In Host, click the name of the host to use when testing verification. The hostname will be similar to the hostname you used for the Host Name Field, as described earlier in this procedure. The suffixes can be different.
- Click SUBMIT. The JSON for the host appears. Look for the host section.
You want to use a name label in the host section. Do not use a host name label outside of that section. - To identify which label to use to build the expression, compare the host/pod/container name in the JSON with the hostname you use when configuring Host Name Field.
- In the Expression for Host Name popover, click the name label to select the expression. Click back in the main dialog to close the Guide From Example. The expression is added to the Expression for Host/Container name field.
For example, if you clicked the name label, the expression ${host.name} is added to the Expression for Host/Container name field.
You can also paste your own JSON object by clicking Paste Custom JSON Response.
Step 9: Timestamp Field
Enter either a static value (such as @timestamp), or a variable expression such as: ${serviceVariable.timestamp_field}.
If you are using a timestamp in the Timestamp Field that is not formatted as epoch/Unix timestamp (the default), then you must enter the format you are using in the Timestamp Format setting. The format is used to parse the timestamp in Timestamp Field.You can also paste your own JSON object by clicking Paste Custom JSON Response.
Step 10: Timestamp Format
Enter the format for the timestamp field in the Elasticsearch record. You can also enter a variable expression, such as: ${serviceVariable.timestamp_format_field}.
If you are entering a literal format, use Kibana to determine the format. In Kibana, use the Discover > Filter feature to construct your timestamp range:
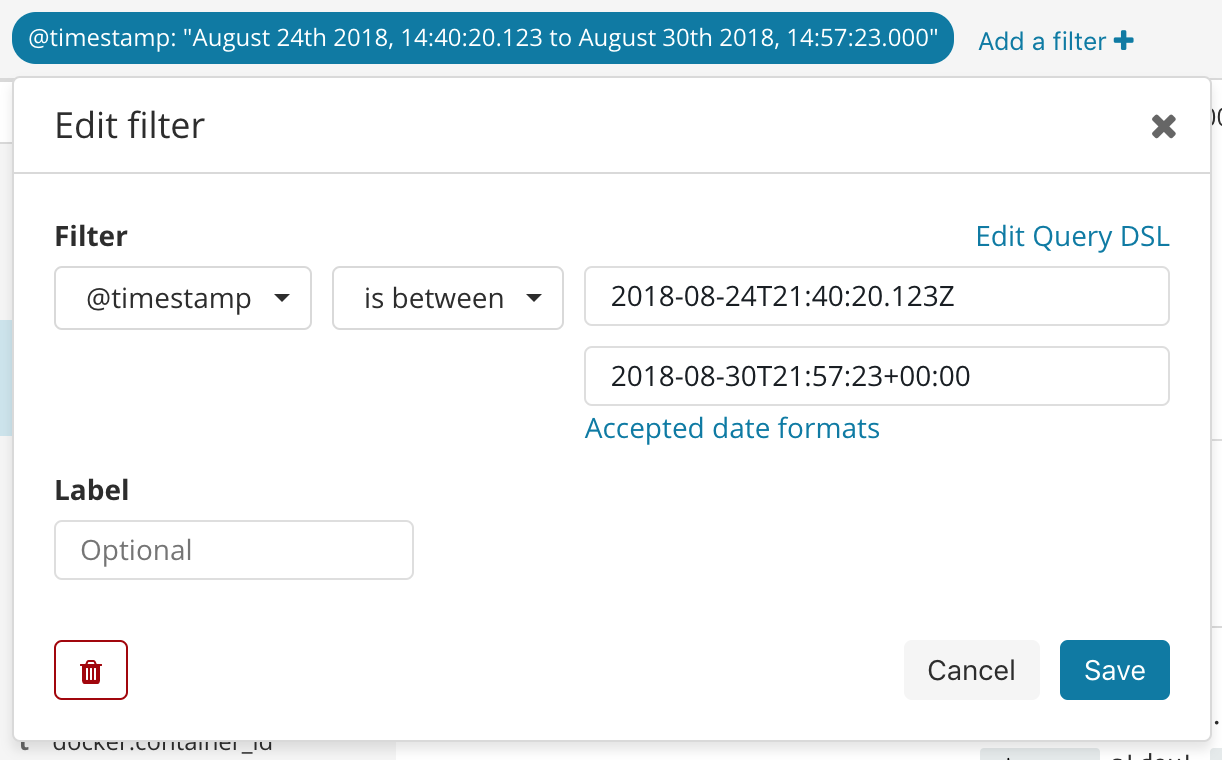
Format Examples:
Timestamp: 2018-08-24T21:40:20.123Z. Format: yyyy-MM-dd'T'HH:mm:ss.SSSX
Timestamp: 2018-08-30T21:57:23+00:00. Format: yyyy-MM-dd'T'HH:mm:ss.SSSXXX
For more information, see Date Math from Elastic.
You can also paste your own JSON object by clicking Paste Custom JSON Response.
Step 11: Test Expression for Host Name
At the bottom of the dialog, click Test.
A new Expression for Host Name popover appears.
In Host, select the same host you selected last time, and then click RUN. Verification for the host is found.
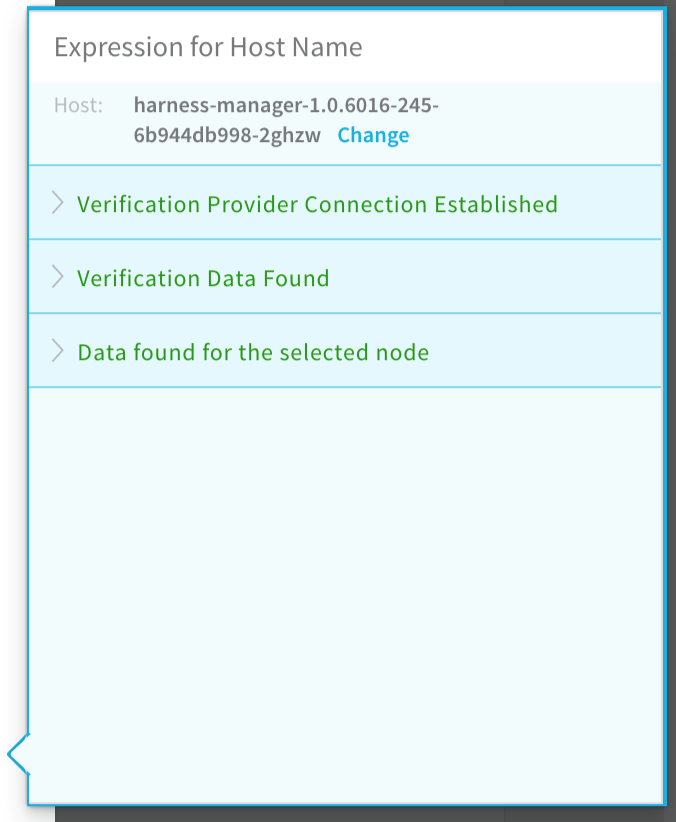
If you receive an error, it is likely because you selected the wrong label in Expression for Host/Container Name or Host Name Field. Resolve the error as needed.
Click Analysis Details.
Step 12: Analysis Period
Set the duration for the verification step. If a verification step exceeds the value, the workflow Failure Strategy is triggered. For example, if the Failure Strategy is Ignore, then the verification state is marked Failed but the workflow execution continues.
Harness waits 2-3 minutes before beginning the analysis to avoid initial deployment noise. This is a standard with monitoring tools.
Step 13: Baseline for Risk Analysis
See CV Strategies, Tuning, and Best Practices.
For Canary Analysis and Previous Analysis, analysis happens at the host/node/pod level. For Predictive Analysis, data collection happens at the host/node/pod level but analysis happens at the application or service level. Consequently, for data collection, provide a query that targets the logs for the host using fields such as SOURCE_HOST in Field name for Host/Container.
Step 14: Algorithm Sensitivity
Select the sensitivity that will result in the most useful results for your analysis.
See CV Strategies, Tuning, and Best Practices.
Step 15: Execute with previous steps
Check this checkbox to run this verification step in parallel with the previous steps in Verify Service.
Step 16: Include instances from previous phases
If you are using this verification step in a multi-phase deployment, select this checkbox to include instances used in previous phases when collecting data. Do not apply this setting to the first phase in a multi-phase deployment.
Click Submit.
Review: Harness Expression Support in CV Settings
You can use expressions (${...}) for Harness built-in variables and custom Service and Workflow variables in the settings of Harness Verification Providers.
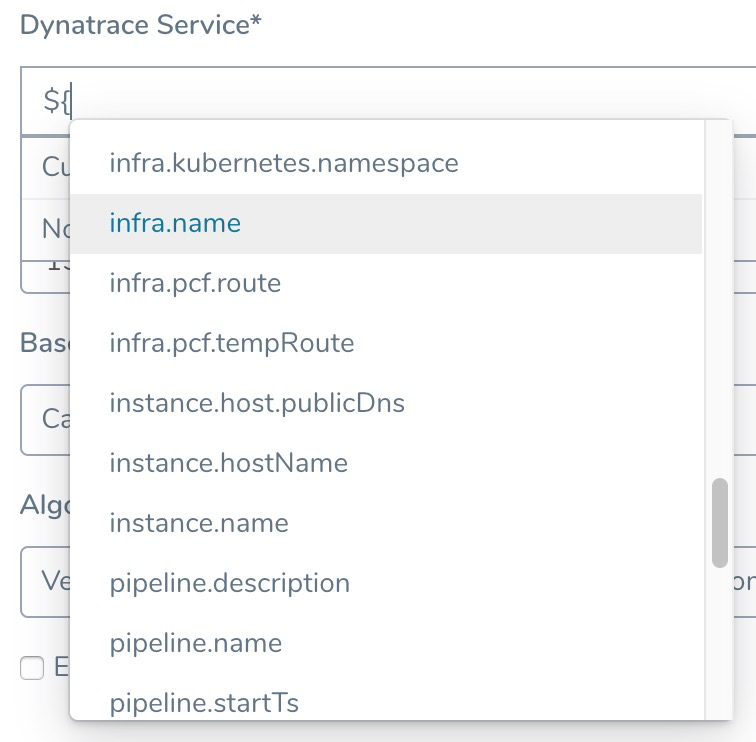
Expression support lets you template your Workflow verification steps. You can add custom expressions for settings, and then provide values for those settings at deployment runtime. Or you can use Harness built-in variable expressions and Harness will provide values at deployment runtime automatically.
Step 17: View Verification Results
Once you have deployed your workflow (or pipeline) using the New Relic verification step, you can automatically verify cloud application and infrastructure performance across your deployment.
Workflow Verification
To see the results of Harness machine-learning evaluation of your ELK verification, in your workflow or pipeline deployment you can expand the Verify Service step and then click the ELK step.
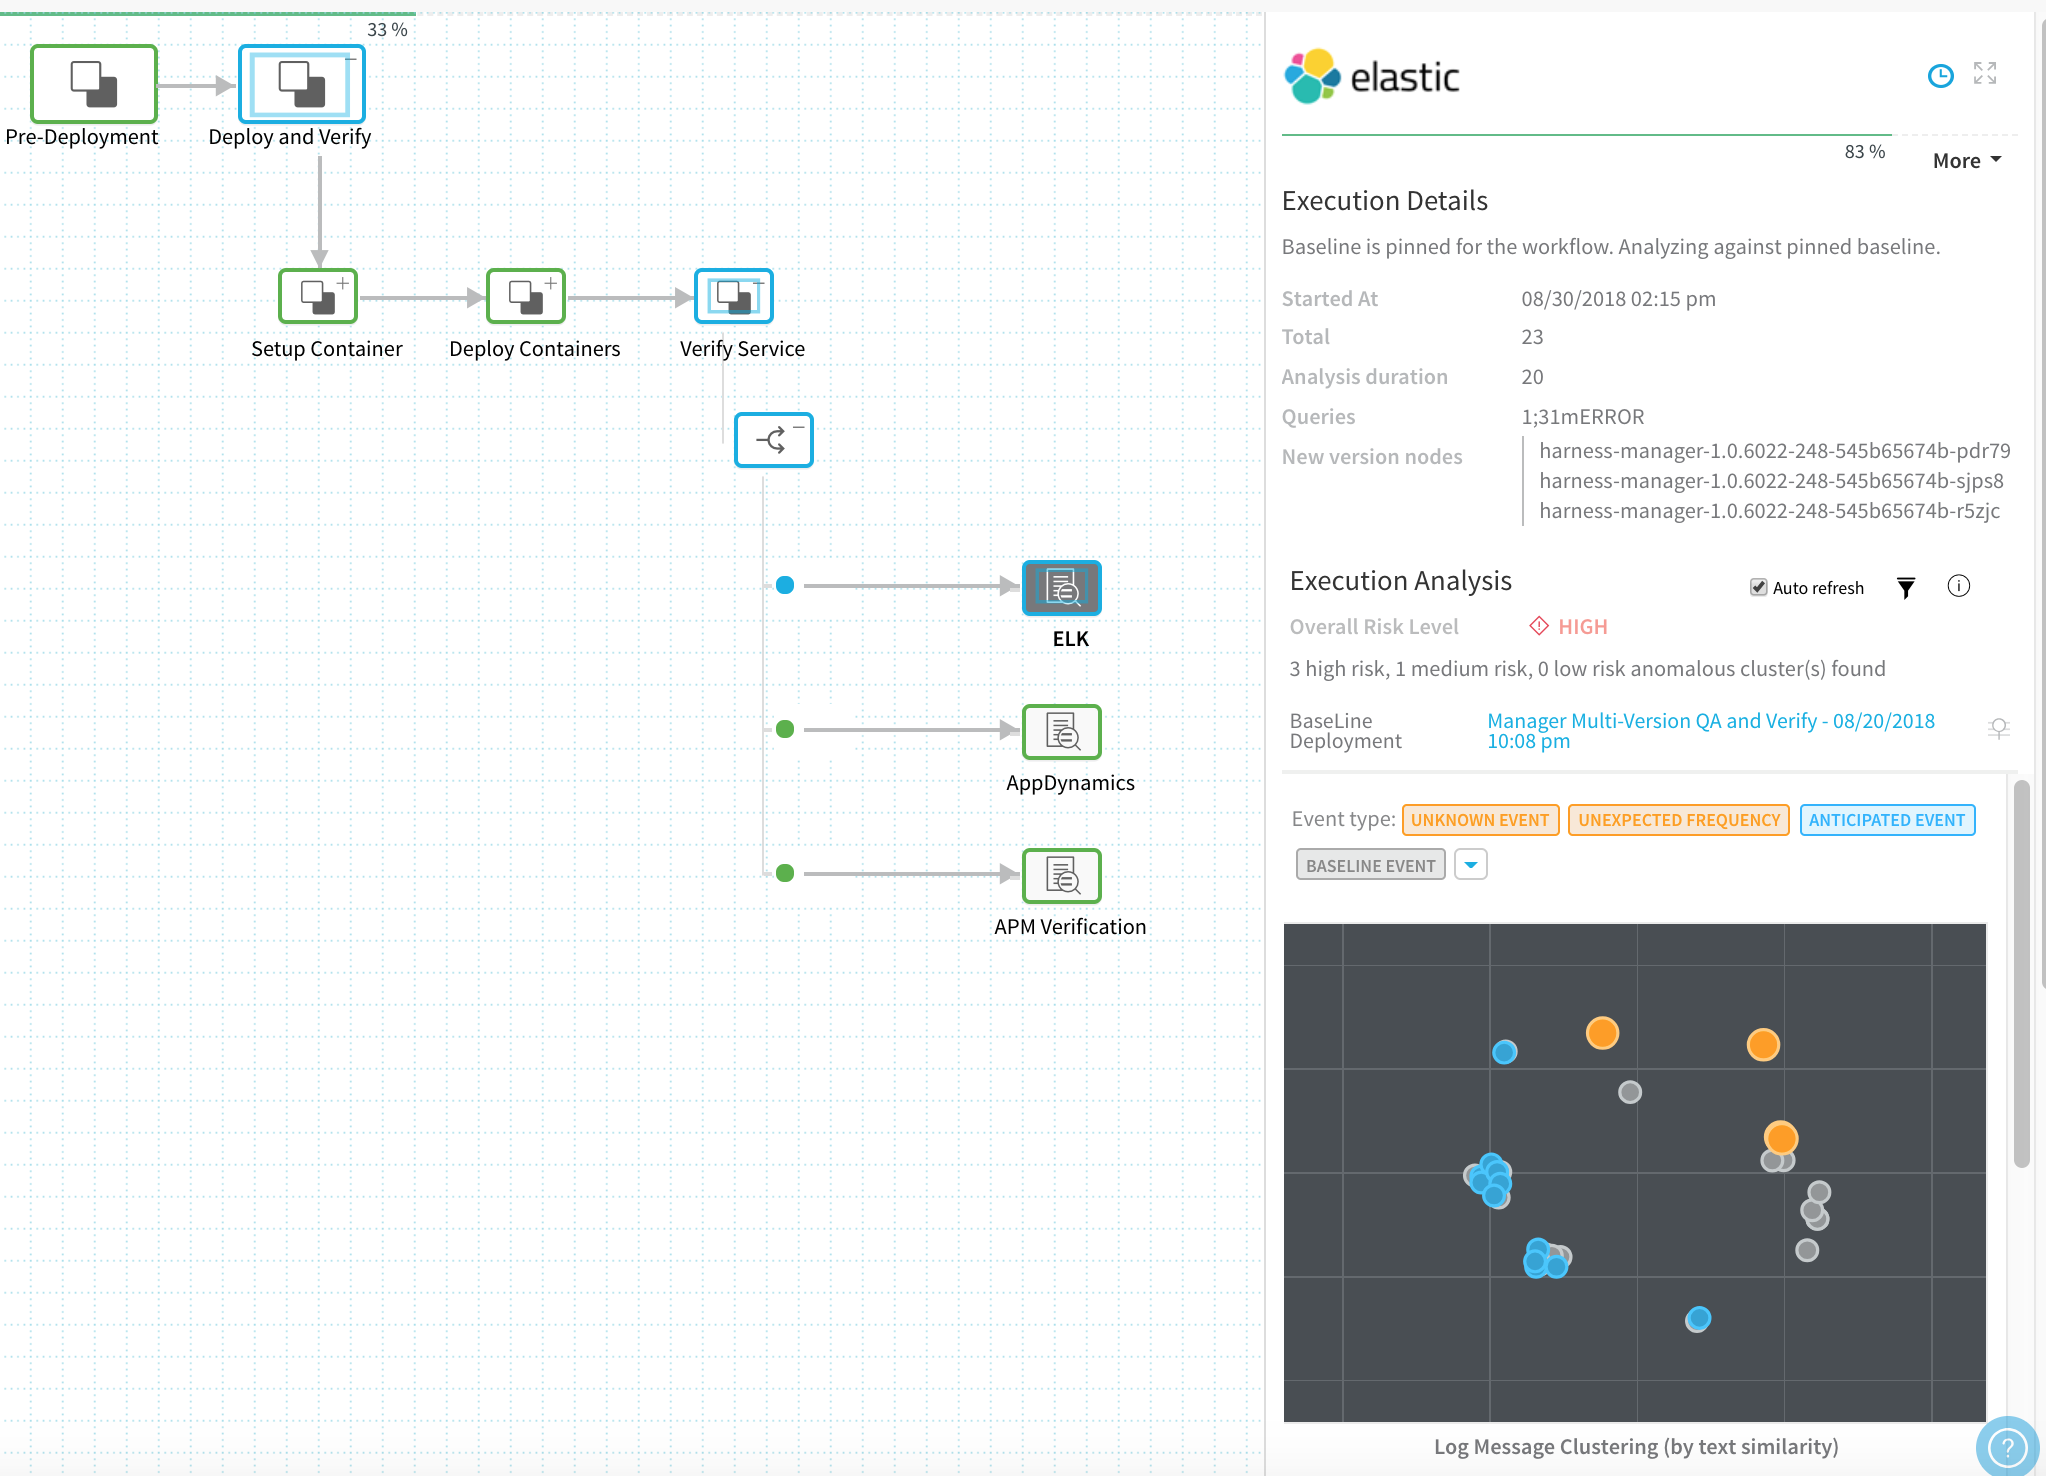
Continuous Verification
You can also see the evaluation in the Continuous Verification dashboard. The workflow verification view is for the DevOps user who developed the workflow. The Continuous Verification dashboard is where all future deployments are displayed for developers and others interested in deployment analysis.
To learn about the verification analysis features, see the following sections.
Transaction Analysis
- Execution details: See the details of verification execution. Total is the total time the verification step took, and Analysis duration is how long the analysis took.
- Risk level analysis: Get an overall risk level and view the cluster chart to see events.
- Transaction-level summary: See a summary of each transaction with the query string, error values comparison, and a risk analysis summary.
Execution Analysis
- Event type: Filter cluster chart events by Unknown Event, Unexpected Frequency, Anticipated Event, Baseline Event, and Ignore Event.
- Cluster chart: View the chart to see how the selected event contrast. Click each event to see its log details.
Event Management
- Event-level analysis: See the threat level for each event captured.
- Tune event capture: Remove events from analysis at the service, workflow, execution, or overall level.
- Event distribution: Click the chart icon to see an event distribution including the measured data, baseline data, and event frequency.
Option: Templatize ELK Verification
Once you have created an ELK verification step, you can templatize certain settings. This enables you to use the ELK verification step in the Workflow (and multiple Pipelines) without having to provide settings until runtime.
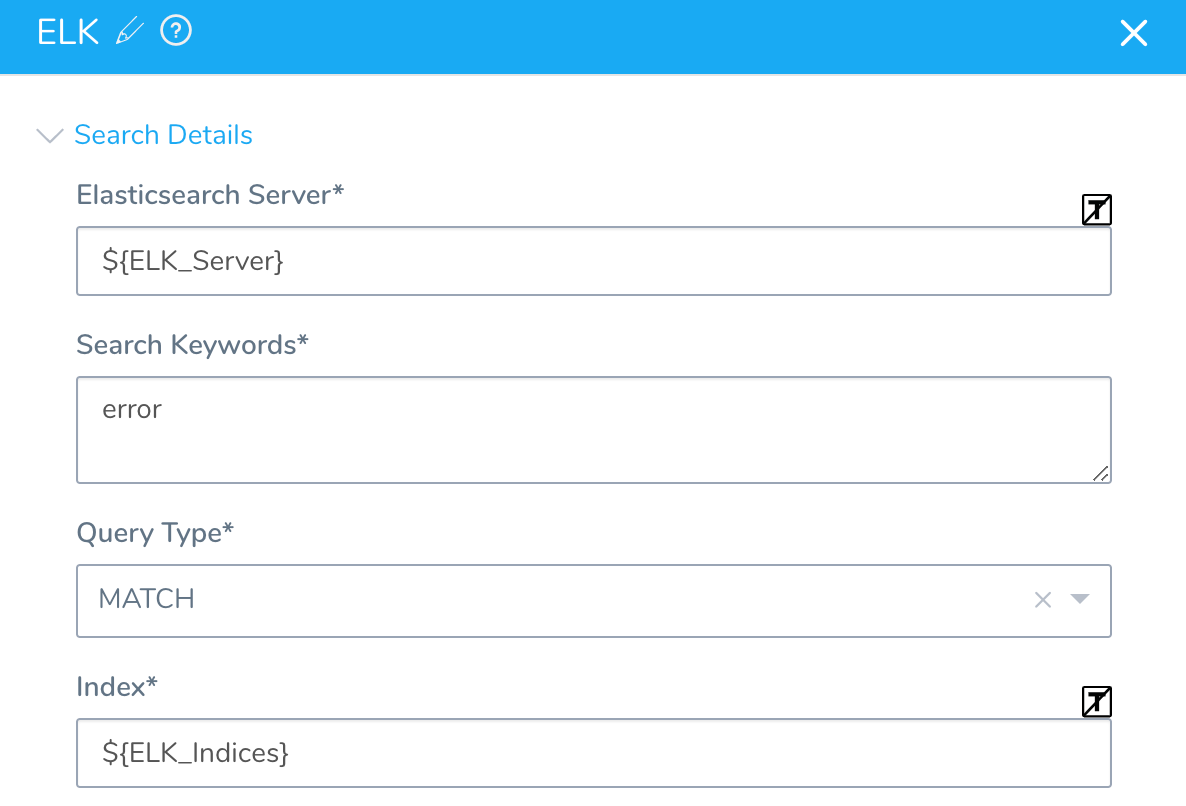
You templatize settings by click the [T] icon next to the setting.
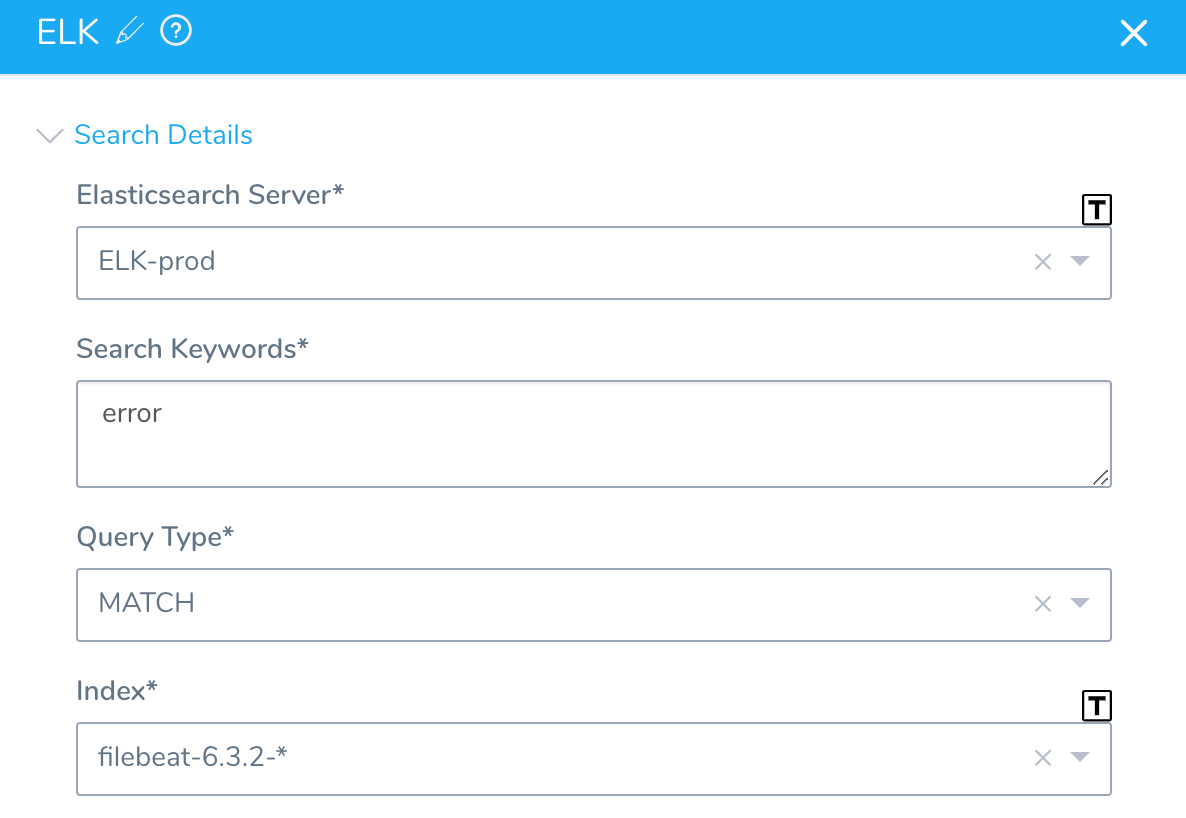
The settings are replaced by Workflow variables:
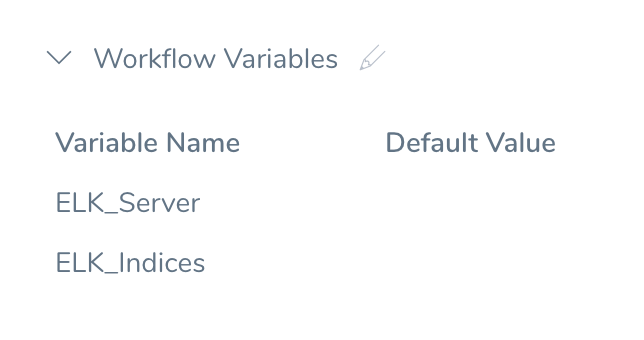
You will now see them in the Workflow Variables section of the Workflow:
When you deploy the Workflow, Start New Deployment prompts you to enter values for templatize settings:
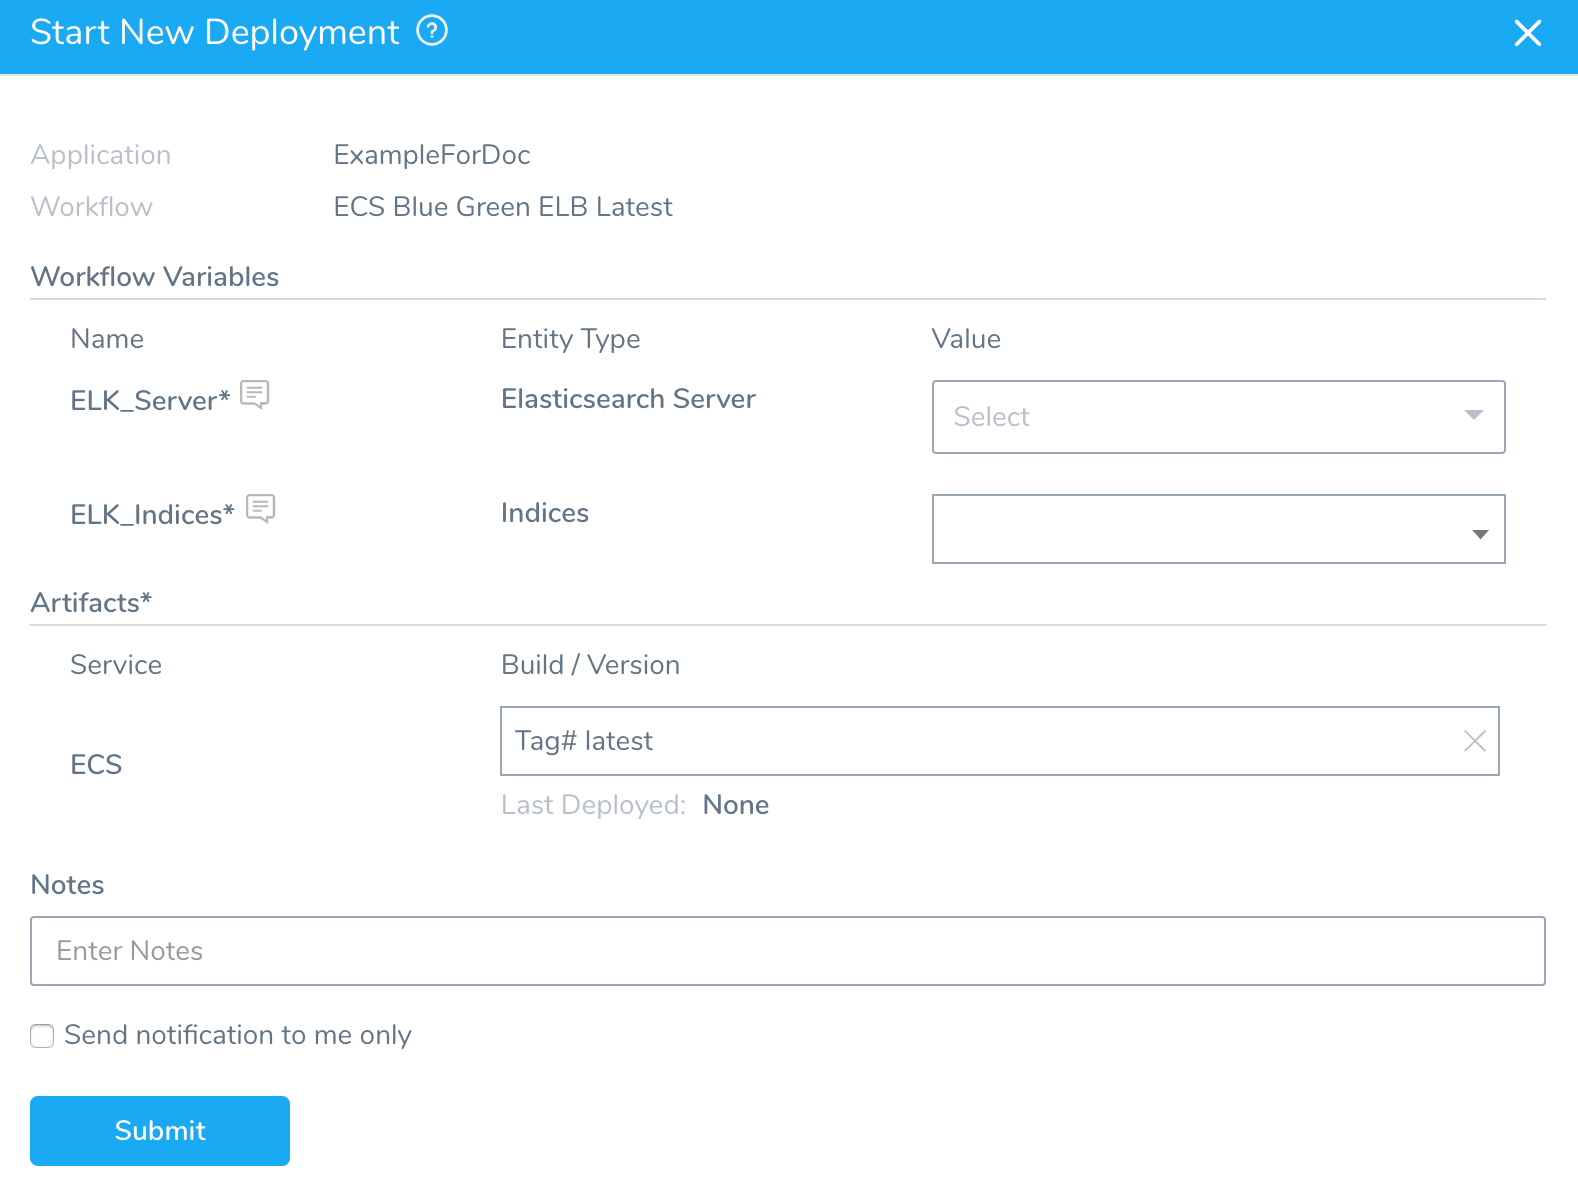
You can select the necessary settings and deploy the Workflow.
You can also pass variables into a Workflow from a Trigger that can be used for templatized values. For more information, see Passing Variables into Workflows and Pipelines from Triggers.