Verify Deployments with Prometheus
When Harness deploys a new application or service to the target environment defined in the workflow, it will immediately connect to the Prometheus Server and build a model of what it is observing.
Next, Harness compares this model with previous deployment models to identify anomalies or regressions. If necessary, Harness rolls back to the previous working version automatically. For more information, see Rollback Steps.
Before You Begin
- Set up a Harness Application, containing a Service and Environment. See Create an Application.
- See the Prometheus Verification Overview.
Visual Summary
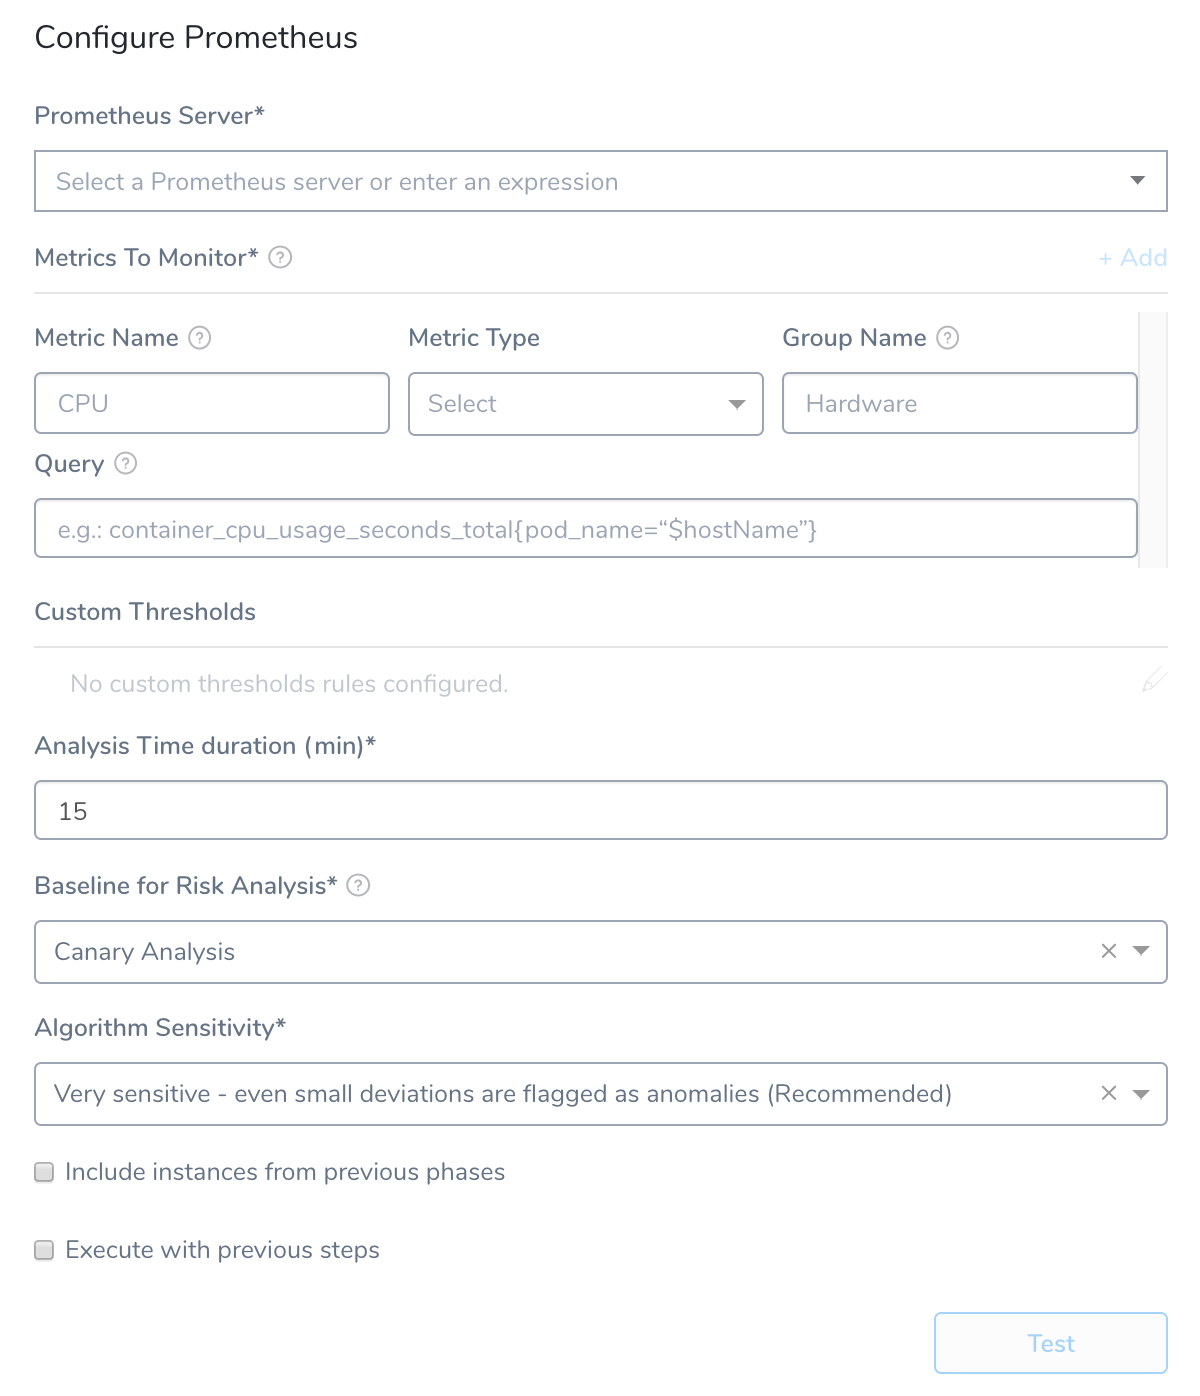
Here's an example of a Prometheus setup for verification.

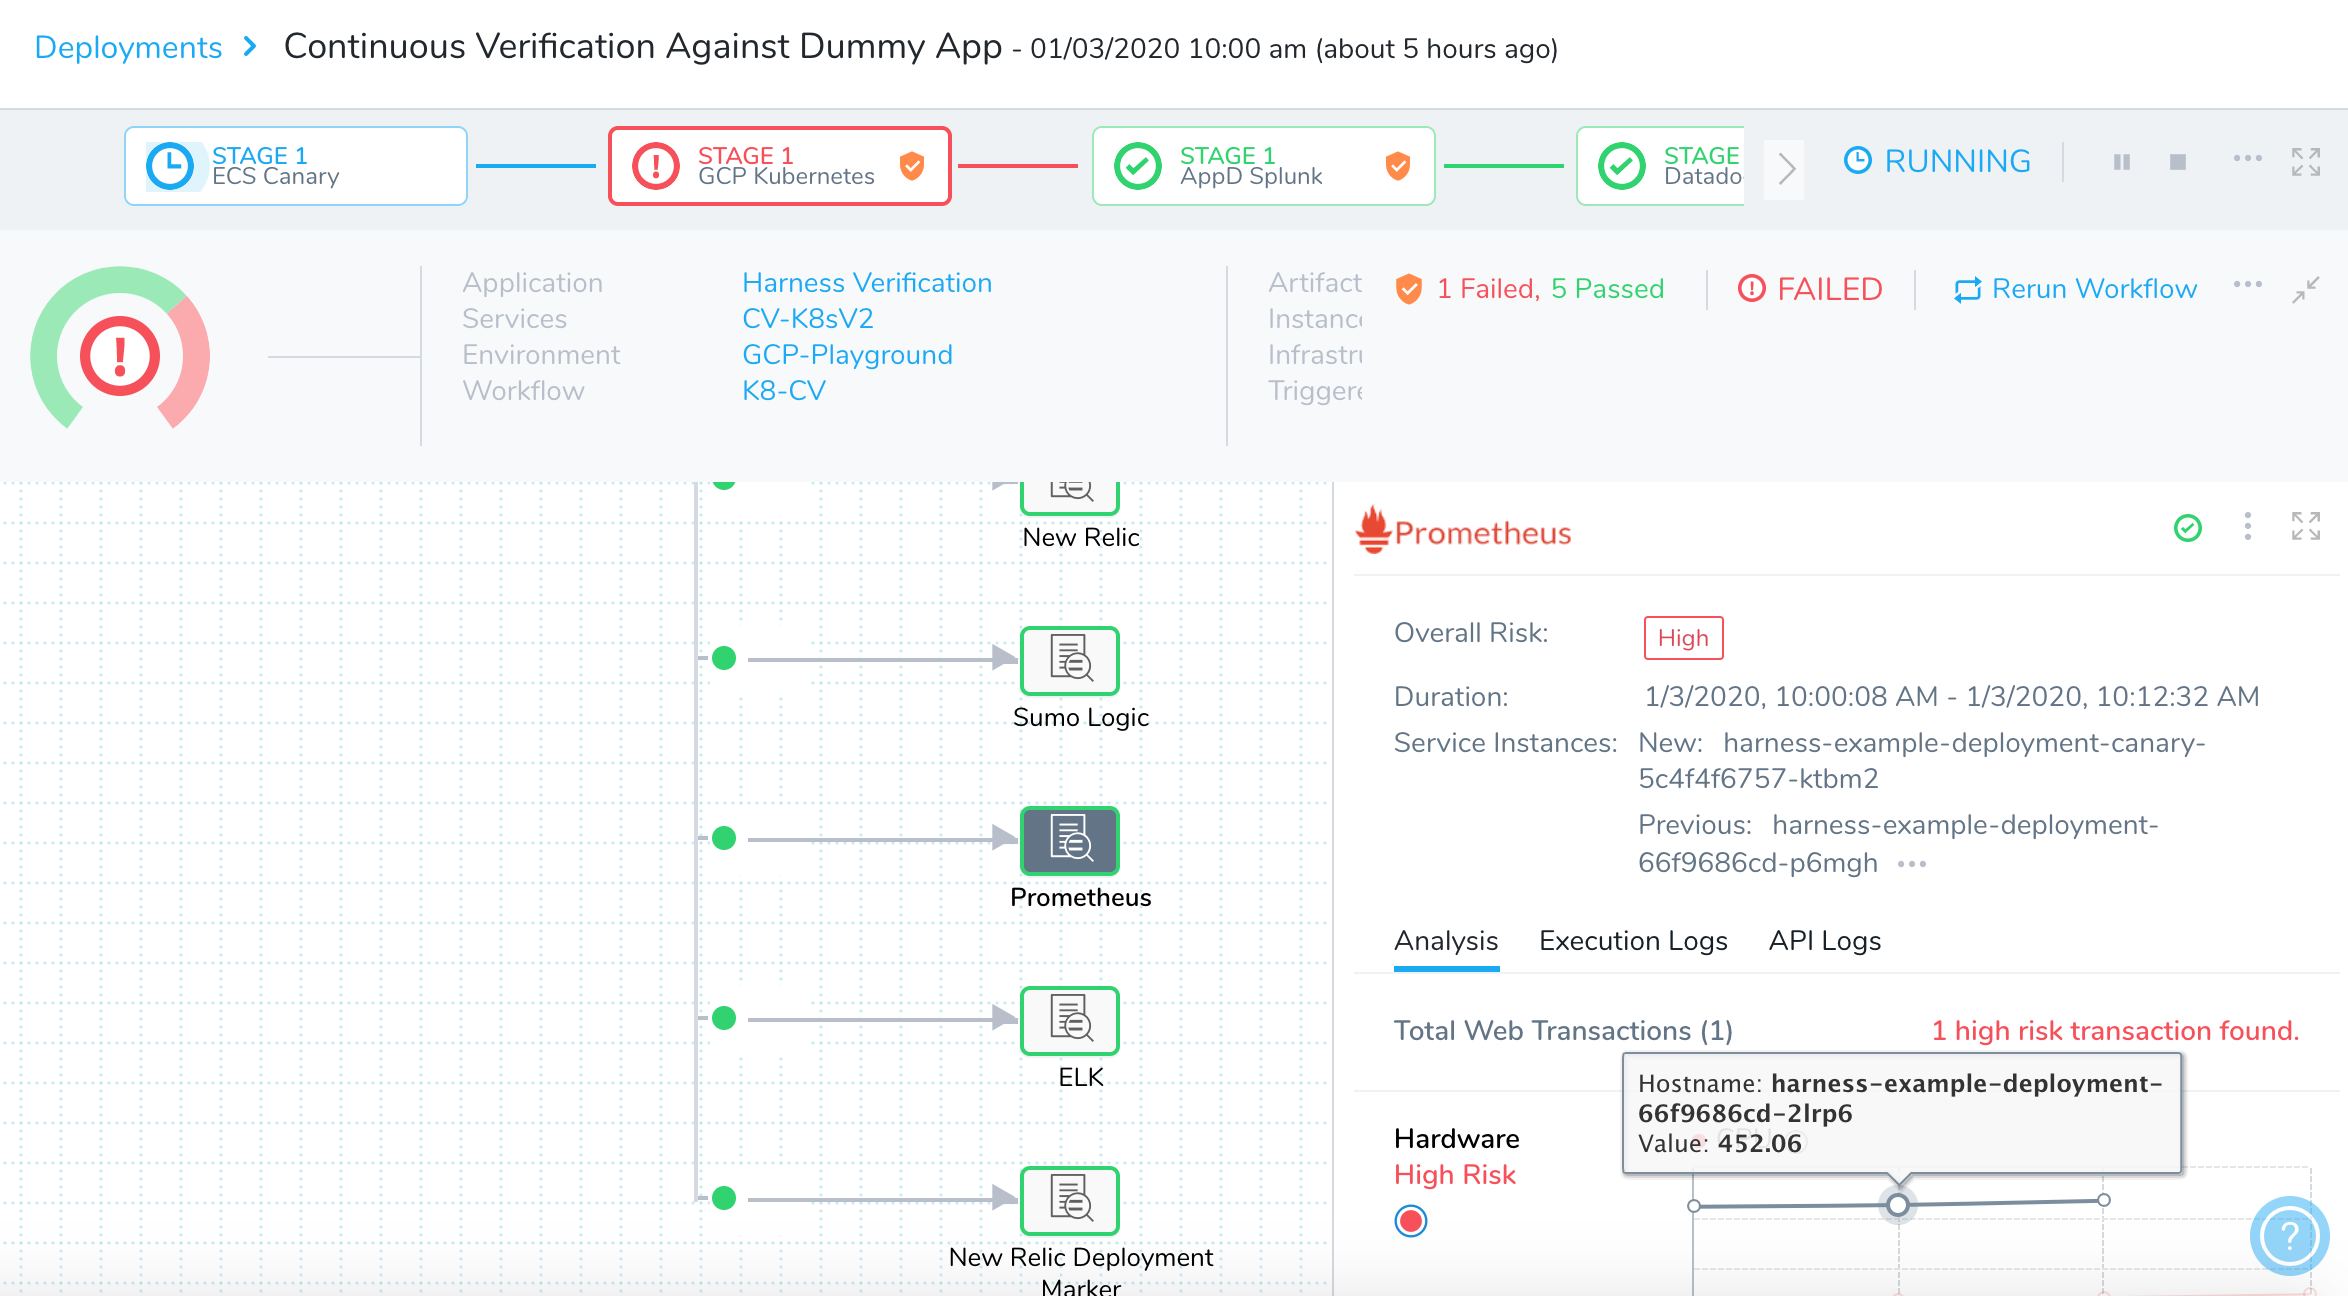
Here is an example of a deployment Pipeline Stage verified using Prometheus.

Under Prometheus, you can see that all Prometheus metrics have been validated by the Harness machine learning algorithms. Green indicates that there are no anomalies or regressions identified and the deployment is operating within its normal range.
Step 1: Set Up the Deployment Verification
To verify your deployment with Prometheus, do the following:
Ensure that you have added Prometheus as a verification provider, as described in Prometheus Connection Setup.
In your Workflow, under Verify Service, click Add Verification.
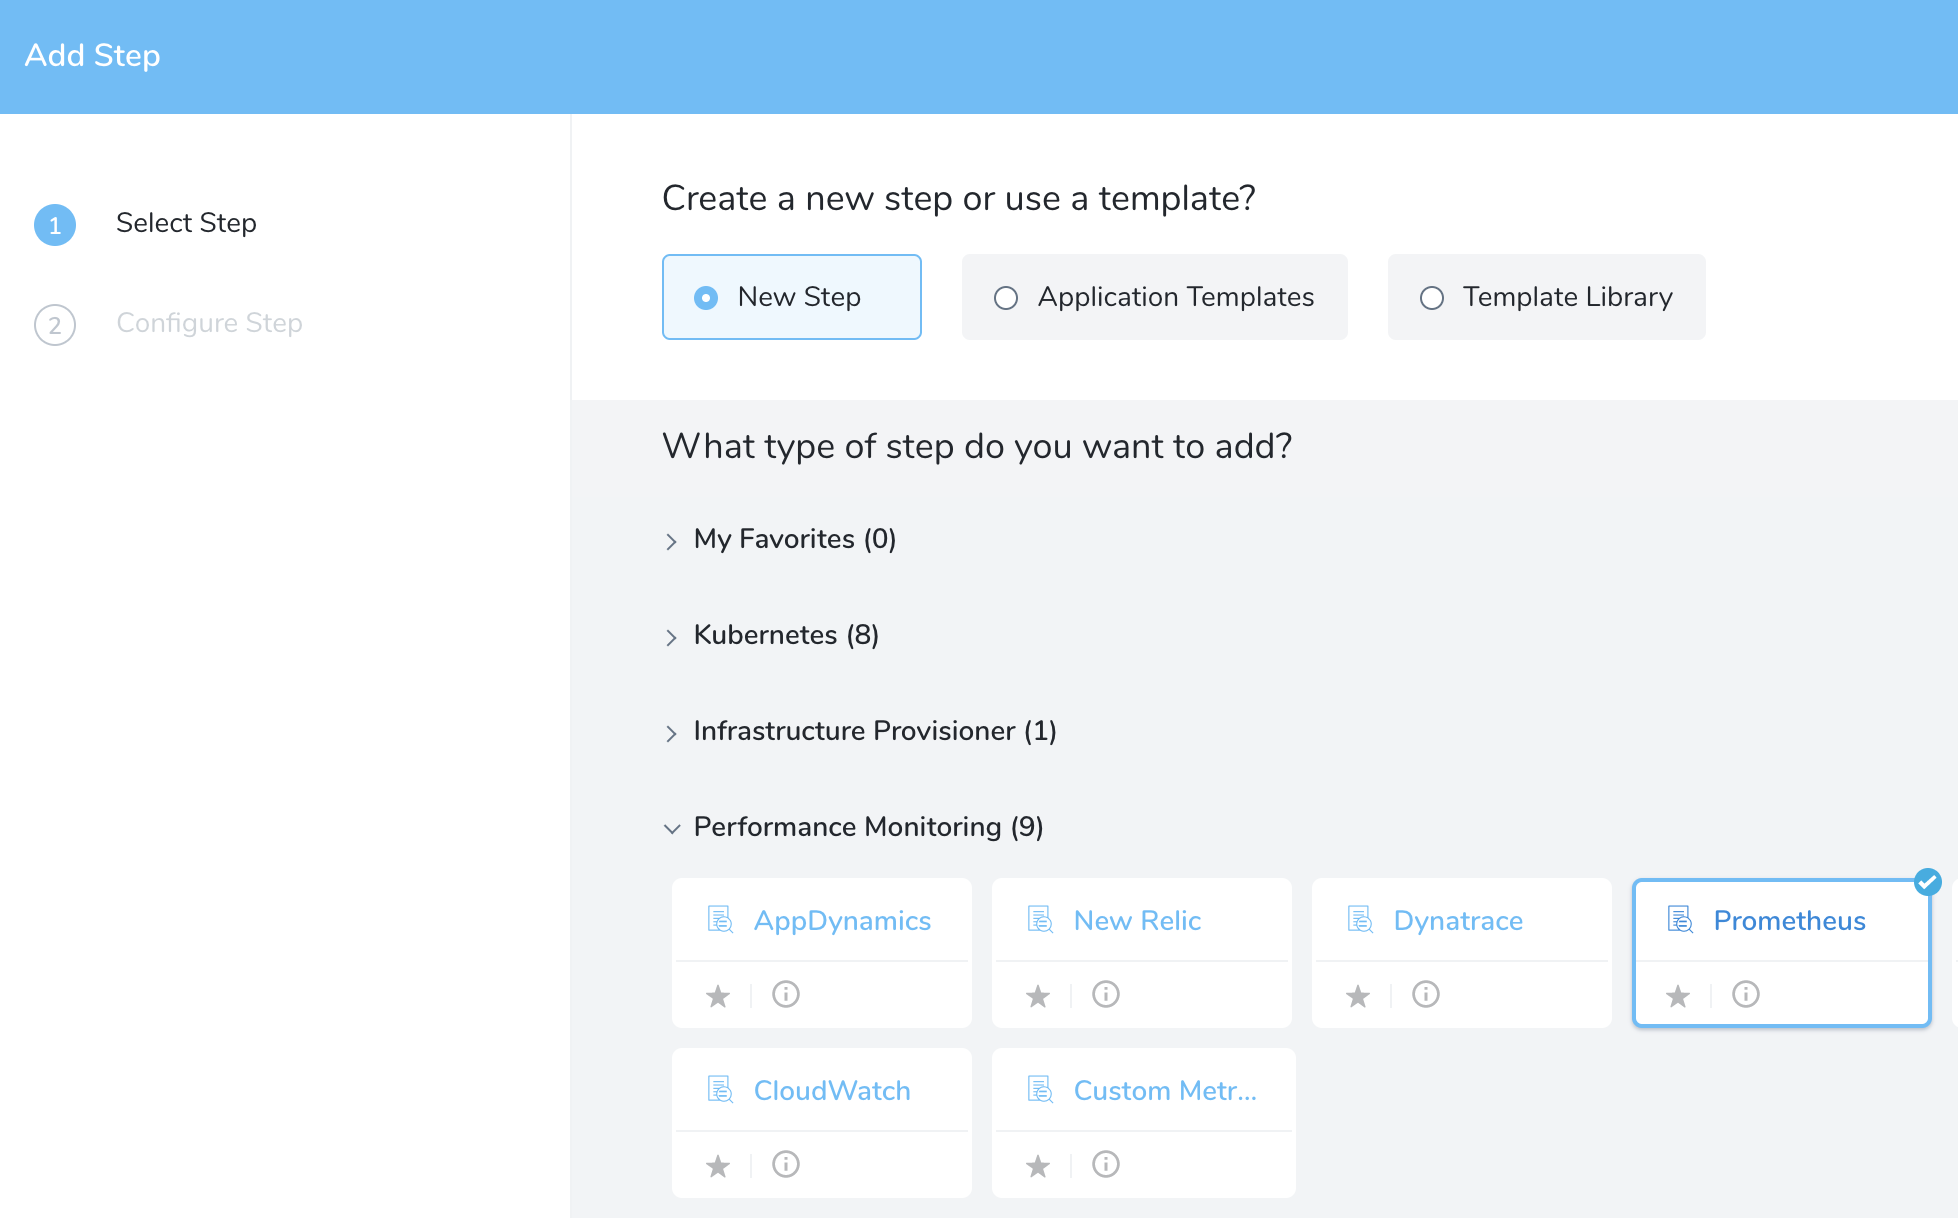
In the resulting Add Step settings, select Performance Monitoring > Prometheus.

Click Next. The Configure**Prometheus** settings appear.

The Configure Prometheus settings include the following fields.
Step 2: Prometheus Server
Select the server you added when setting up the Prometheus Connection Setup.
Step 3: Metrics to Monitor
Every time series is uniquely identified by its metric name and a set of key-value pairs, also known as labels. For more information, see Data Model from Prometheus. A metric requires the following parameters:
- Metric Name: The name of the metric defined in Prometheus.
- Metric Type: The type of metric (Response Time, Error, Infra, Throughput, or Value).
- Group Name: The transaction (service or request context) which the metric relates to. For example, Login or Hardware.
- Query: The API query required to retrieve the metric value. This query must include a placeholder for hostname,
$hostName.
When you add your query in Query, you want the query to return a single time series result for the metric and transaction you identify. If it returns multiple results, Harness will not process your verification step.For Query, you can simply copy your query from Prometheus and paste it into Harness, and then replace the actual hostname in the query with $hostName.
For example, here is a query in Prometheus:
The actual query string is:
container_cpu_usage_seconds_total{pod_name="prometheus-deployment-7c878596ff-r8qrt",namespace="harness"}
When you paste that string into the Query field in Harness, you replace the pod_name value with $hostName:
container_cpu_usage_seconds_total{pod_name="$hostName",namespace="harness"}
Always Use Throughput with Error and Response Time Metrics
Whenever you use the Error metric type, you should also add another metric for Throughput with the same Group Name.
Harness analyze errors as error percentage and without the throughput the error number does not provide much information.
The same setup should used with the Response Time metric also. Whenever you set up a Response Time metric, setup a Throughput metric with the same Group Name.
Step 4: Custom Thresholds
In the Custom Thresholds section, define two types of rules that override normal verification behavior:
- Ignore Hints instruct Harness to skip certain metrics/value combinations from verification analysis.
- Fast-Fail Hints cause a Workflow to promptly enter a failed state.
To configure these rules, see Apply Custom Thresholds to Deployment Verification.
Step 5: Analysis Time Duration
Set the duration for the verification step. If a verification step exceeds the value, the workflow Failure Strategy is triggered. For example, if the Failure Strategy is Ignore, then the verification state is marked Failed but the workflow execution continues.
See CV Strategies, Tuning, and Best Practices.
Step 6: Baseline for Risk Analysis
Canary Analysis: (Available in Workflows using the Canary and Rolling Workflow Types)
Harness will compare the metrics received for the nodes deployed in each phase with metrics received for the rest of the nodes in the application. For example, if this phase deploys to 25% of your nodes, the metrics received from Prometheus during this deployment for these nodes will be compared with metrics received for the other 75% during the defined period of time.
Previous Analysis: (Available in Workflows using the Basic, Blue/Green, and Rolling Workflow Types)
Harness will compare the metrics received for the nodes deployed in each phase with metrics received for all the nodes during the previous deployment. For example, if this phase deploys V1.2 to node A, the metrics received from Prometheus during this deployment will be compared to the metrics for nodes A, B, and C during the previous deployment (V1.1). Previous Analysis is best used when you have predictable load, such as in a QA environment.
See CV Strategies, Tuning, and Best Practices.
Step 7: Algorithm Sensitivity
See CV Strategies, Tuning, and Best Practices.
Step 8: Include instances from previous phases
If you are using this verification step in a multi-phase deployment, select this checkbox to include instances used in previous phases when collecting data. Do not apply this setting to the first phase in a multi-phase deployment.
Step 9: Execute with previous steps
Check this checkbox to run this verification step in parallel with the previous steps in Verify Service.
Step 10: Test Configuration
Click Test.
If a multiple time series error occurs as follows, add more filters to your query to configure successfully.
Error while saving Prometheus configuration. Multiple time series values are returned for metric name CPU and group name Hardware. Please add more filters to your query to return only one time series.
Update your query to add more filters (like container_name = "POD"), as follows:
query=container_cpu_usage_seconds_total{pod_name="$hostName", container_name="POD"}
Review: Harness Expression Support in CV Settings
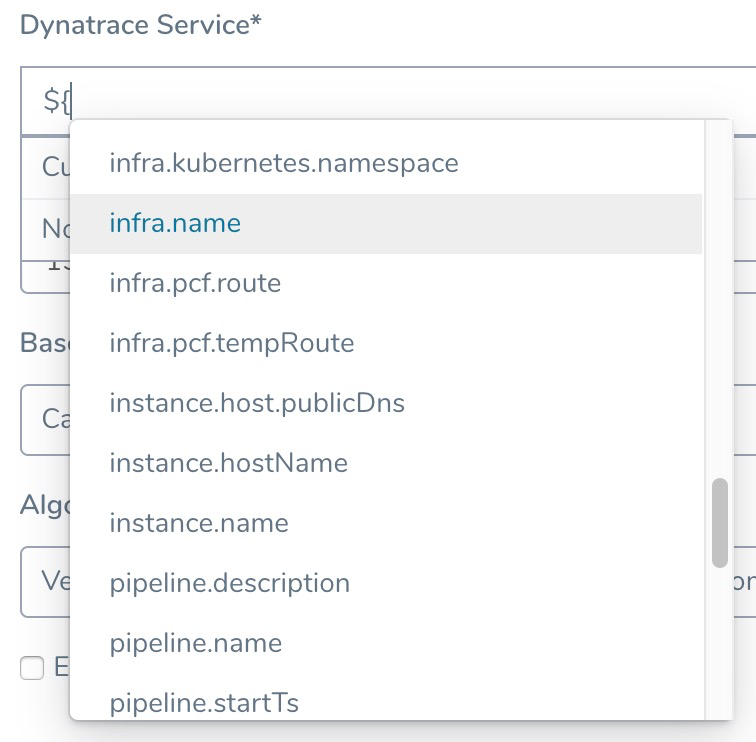
You can use expressions (${...}) for Harness built-in variables and custom Service and Workflow variables in the settings of Harness Verification Providers.

Expression support lets you template your Workflow verification steps. You can add custom expressions for settings, and then provide values for those settings at deployment runtime. Or you can use Harness built-in variable expressions and Harness will provide values at deployment runtime automatically.
Step 11: View Verification Results
When Harness deploys a new application or service to the target environment defined in the workflow, it will immediately connect to the Prometheus Server and build a model of what it is observing.
Next, Harness compares this model with previous deployment models to identify anomalies or regressions. If necessary, Harness rolls back to the previous working version automatically. For more information, see Rollback Steps.
Here is an example of a deployment Pipeline Stage verified using Prometheus.

Under Prometheus, you can see that all Prometheus metrics have been validated by the Harness machine learning algorithms. Green indicates that there are no anomalies or regressions identified and the deployment is operating within its normal range.
To see an overview of the verification UI elements, see Continuous Verification Tools.
