Monitor Applications 24/7 with Splunk
Harness 24/7 Service Guard monitors your live applications, catching problems that surface minutes or hours following deployment. For more information, see 24/7 Service Guard Overview.
You can add your Splunk monitoring to Harness 24/7 Service Guard in your Harness Application Environment. For a setup overview, see Connect to Splunk.
Before You Begin
- See the Splunk Verification Overview.
- See Connect to Splunk.
Visual Summary
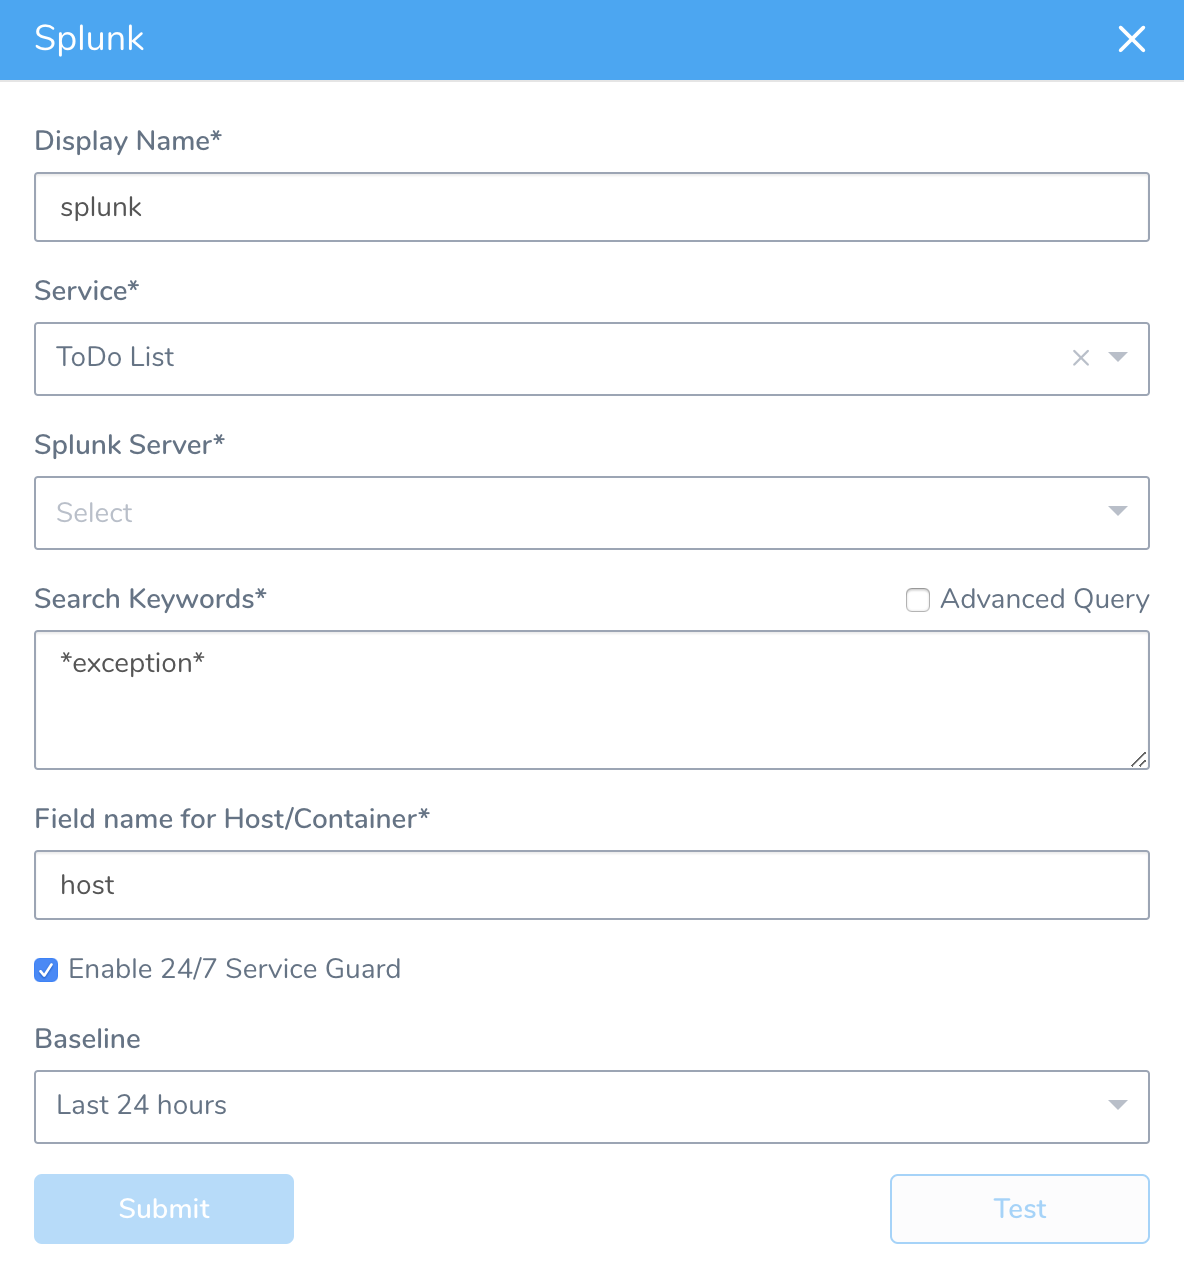
Here's an example configuration of 24/7 Service Guard for Splunk.

Step 1: Set Up 24/7 Service Guard for Splunk
To set up 24/7 Service Guard for Splunk:
Ensure that you have added Splunk as a Harness Verification Provider, as described in Connect to Splunk.
In your Harness Application, ensure that you have added a Service, as described in Services. For 24/7 Service Guard, you do not need to add an Artifact Source to the Service, or configure its settings. You simply need to create a Service and name it. It will represent your application for 24/7 Service Guard.
In your Harness Application, click Environments.
In Environments, ensure that you have added an Environment for the Service you added. For steps on adding an Environment, see Environments.
Click the Environment for your Service. Typically, the Environment Type is Production.
In the Environment page, locate 24/7 Service Guard.
In 24/7 Service Guard, click Add Service Verification, and then click Splunk. The Splunk dialog appears.

Fill out the dialog. The dialog has the following fields.
For 24/7 Service Guard, the queries you define to collect logs are specific to the application or service you want monitored. Verification is application/service level. This is unlike Workflows, where verification is performed at the host/node/pod level.
Step 2: Display Name
The name that will identify this service on the Continuous Verification dashboard. Use a name that indicates the environment and monitoring tool, such as Splunk.
Step 3: Service
The Harness Service to monitor with 24/7 Service Guard.
Step 4: Splunk Server
Select the Harness Verification Provider you configured using your Splunk account.
Step 5: Search Keywords
Enter a search term or query. To search for all exceptions, use asterisks (*) around exception, for example, *exception*. For more information, see Retrieve events from the index from Splunk.
When you enter a search such as *exception*, at runtime Harness will generate a query containing your search and information Harness needs to perform monitoring, such as the information following *exception* below:
search *exception* host = ip-172-31-81-88 | bin _time span=1m |


cluster t=0.9999 showcount=t labelonly=t|


table _time, _raw,cluster_label, host |


stats latest(_raw) as _raw count as cluster_count by _time,cluster_label,host
If you want more flexibility in your search, or to repurpose Splunk searches you already have, you can click Advanced Query and enter whatever you like in Search Keywords. Simply copy and paste your Splunk query into Harness, such as search index=*prod *exception*.
Note that you will specify host field name and host/pod/container name in other settings so you do not need to include them in the search query.
Step 6: Field name for Host/Container
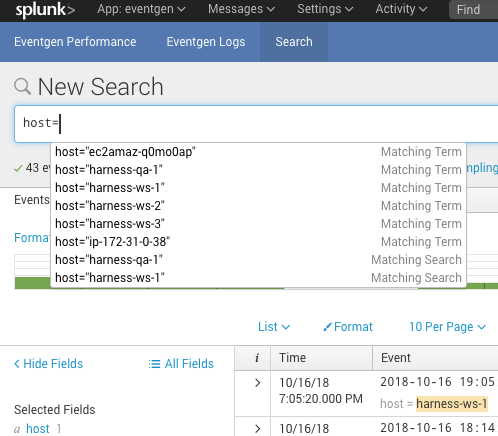
Typically, you will enter host. You can enter host into the Splunk Search field to see the host for your Harness deployment:
Step 7: Baseline
Select the baseline for comparison.
Step 8: Execute with previous steps
Check this checkbox to run this verification step in parallel with the previous steps in Verify Service.
For more information, see 24/7 Service Guard Overview.
Troubleshoot: Splunk Connectivity and Service Guard Configuration
If you are able to test the connection while configuring Splunk, but unable to schedule a job while setting up 24/7 Service Guard:
- Make sure the permissions of the Splunk user are granted for REST API.
- If all the permissions are granted, create a new user in Splunk and verify if the CURL call from this user works.
- On Harness On-Prem, make sure the firewall port is open for the Splunk REST API access.
