Verify Deployments with Splunk
The following procedure describes how to add Splunk as a verification step in a Harness workflow. For more information about workflows, see Add a Workflow.
Once you run a deployment and Splunk preforms verification, Harness' machine-learning verification analysis will assess the risk level of the deployment.
In order to obtain the names of the host(s), pod(s), or container(s) where your service is deployed, the verification provider should be added to your workflow after you have run at least one successful deployment.
Before You Begin
Visual Summary
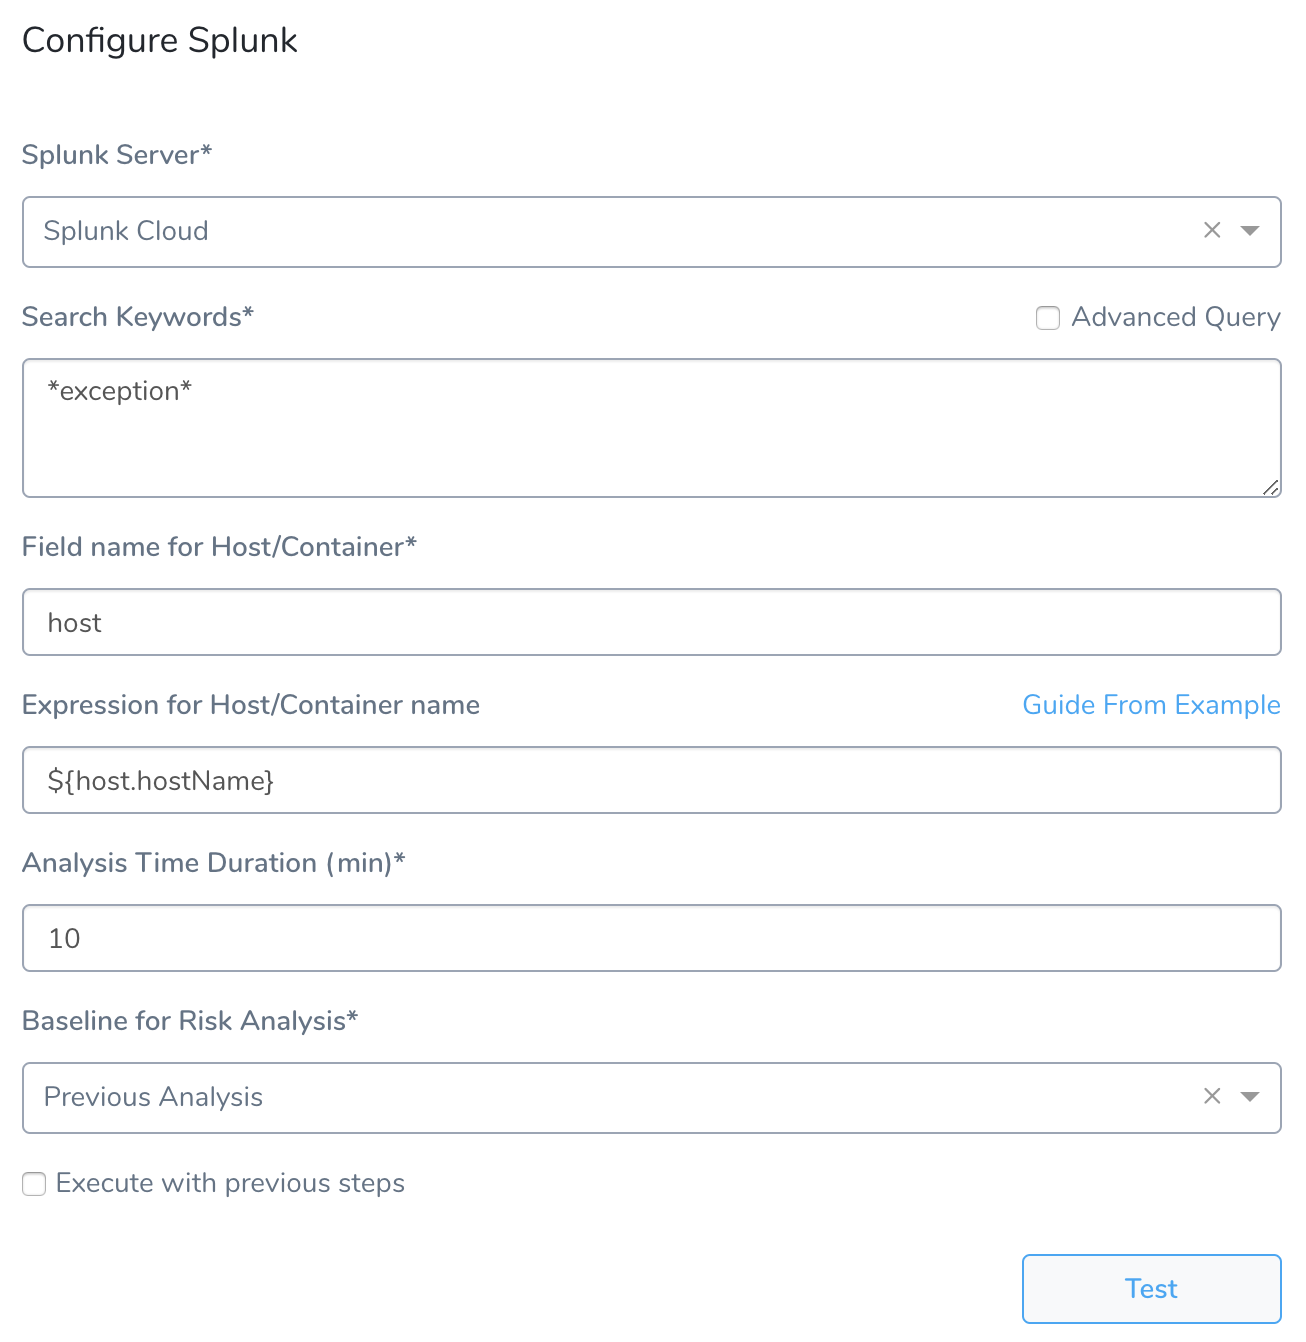
Here's an example configuration of the Splunk Deployment Verification.
Step 1: Set Up the Deployment Verification
To verify your deployment with Splunk, do the following:
Ensure that you have added Splunk as a verification provider, as described in Splunk Connection Setup.
In your Workflow, under Verify Service, click Add Verification.
In the resulting Add Step settings, select Log Analysis > Splunk.
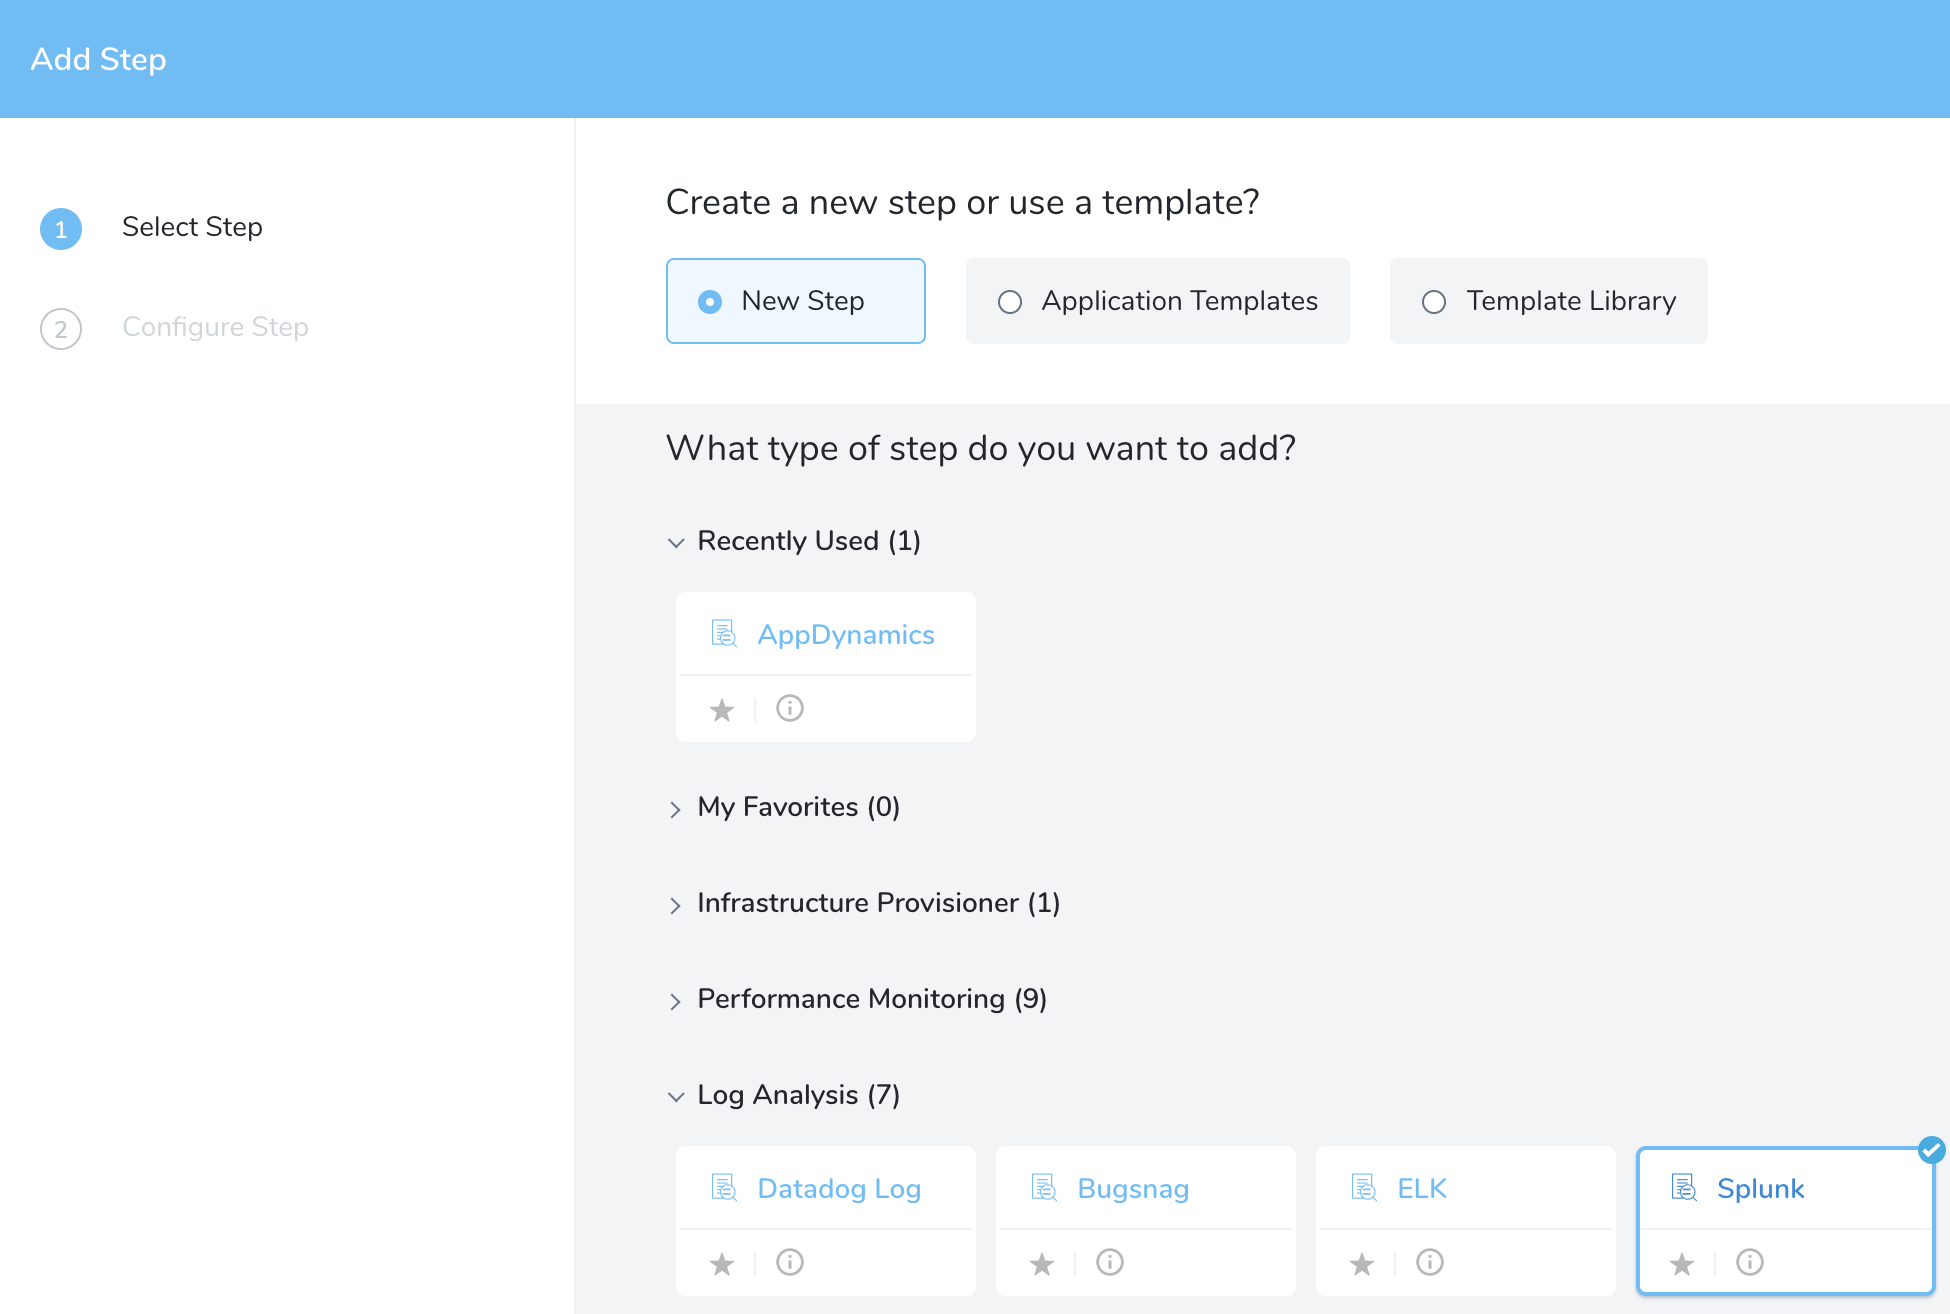
Click Next. The Configure Splunk settings appear.

These settings include the following fields.
Step 2: Splunk Server
Select the Harness Verification Provider you configured using your Splunk account.
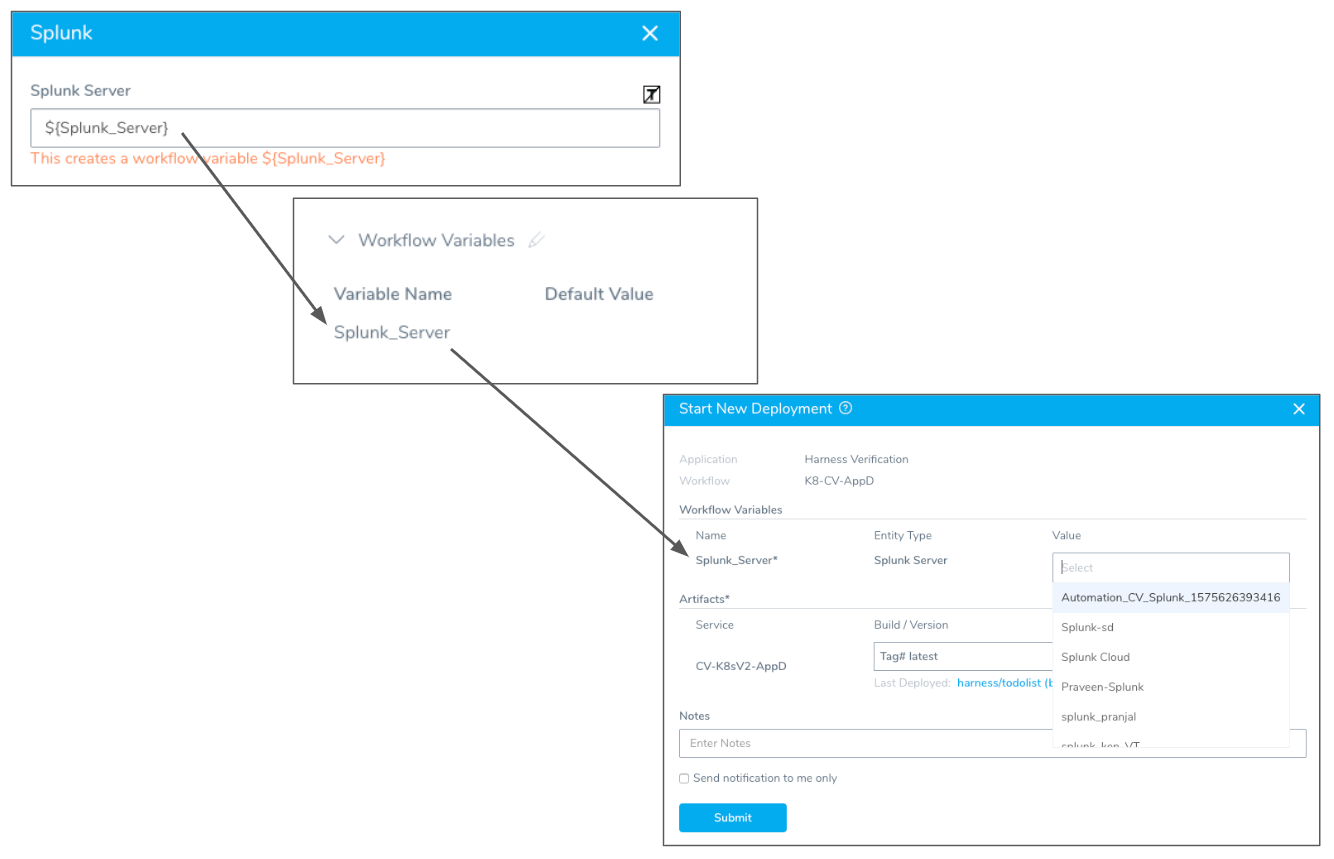
You can templatize the Splunk Server setting by clicking the [T] button. This puts the expression ${Splunk_Server} in the Splunk Server setting. You can change the variable name in the expression.
When you templatize the Splunk Server setting, it creates a Workflow variable, which is a parameter that must be given a value when the Workflow is deployed.
The following diagram shows the templatized Splunk Server setting, the Workflow variable it creates, and how you can provide a value when you deploy the Workflow.
Step 3: Search Keywords
Enter a search term or query. To search for all exceptions, use asterisks (*) around exception, for example, *exception*. For more information, see Retrieve events from the index from Splunk.
When you enter a search such as *exception*, at runtime Harness will generate a query containing your search and information Harness needs to perform verification, such as the information following *exception* below:
search *exception* host = ip-172-31-81-88 | bin _time span=1m |
cluster t=0.9999 showcount=t labelonly=t|
table _time, _raw,cluster_label, host |
stats latest(_raw) as _raw count as cluster_count by _time,cluster_label,host
If you want more flexibility in your search, or to repurpose Splunk searches you already have, you can click Advanced Query and enter whatever you like in Search Keywords. For example, you could replace *exception* with an existing Splunk search like search index=*prod *exception*.
Note that you will specify host field name and host/pod/container name in other settings so you do not need to include them in the search query.
Step 4: Field name for Host/Container
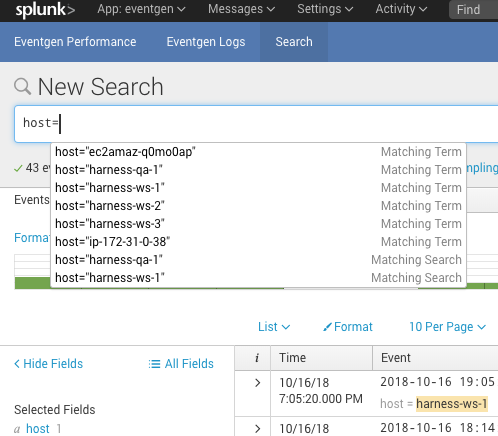
Typically, you will enter host. You can enter host into the Splunk Search field to see the host for your Harness deployment:
Step 5: Expression for Host/Container name
See Guide From Example.
Step 6: Analysis Time duration
Set the duration for the verification step. If a verification step exceeds the value, the workflow Failure Strategy is triggered. For example, if the Failure Strategy is Ignore, then the verification state is marked Failed but the workflow execution continues.
See CV Strategies, Tuning, and Best Practices.
Step 7: Baseline for Risk Analysis
Canary Analysis - Harness will compare the metrics received for the nodes deployed in each phase with metrics received for the rest of the nodes in the application. For example, if this phase deploys to 25% of your nodes, the metrics received from Splunk during this deployment for these nodes will be compared with metrics received for the other 75% during the defined period of time.
Previous Analysis - Harness will compare the metrics received for the nodes deployed in each phase with metrics received for all the nodes during the previous deployment. For example, if this phase deploys V1.2 to node A, the metrics received from Splunk during this deployment will be compared to the metrics for nodes A, B, and C during the previous deployment (V1.1).
See CV Strategies, Tuning, and Best Practices.
Step 8: Execute with previous steps
Check this checkbox to run this verification step in parallel with the previous steps in Verify Service.
Option: Use Guide from Example - Host field
This section uses a host field for the Expression for Host/Container name field. For Kubernetes, see Kubernetes and Splunk.In the Splunk verification step dialog, you can see the Guide From Example option next to the Expression for Host/Container name field. This option lets you select the host(s), pod(s), or container(s) for Harness to use when performing verification.

You select the host, pod, or container in Guide From Example, and an expression is added to the Expression for Host/Container name field. The default expression is ${instance.host.hostName}. Typically, you can simply use ${instance.host.hostName}.
For AWS EC2 hostnames, use the expression ${instance.hostName}.In order to obtain the names of the host(s) pod(s), or container(s) where your service is deployed, the verification provider should be added to your workflow after you have run at least one successful deployment. Then the Guide From Example feature can display the host or container name(s) for you to select.To ensure that you pick the right name when using Guide From Example, you can use a host name in Splunk as a guide.
To use Guide From Example for a host or container name expression, do the following:
In Splunk, click App: Search & Reporting, and then click Search & Reporting.
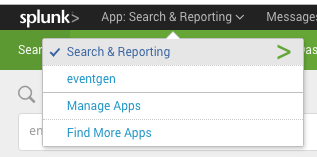
In Search, enter host to see a list of the available hosts being tracked.

Click the name of your host to add it to the search, select a date range, and click the search icon. The event log entries for the host appear.

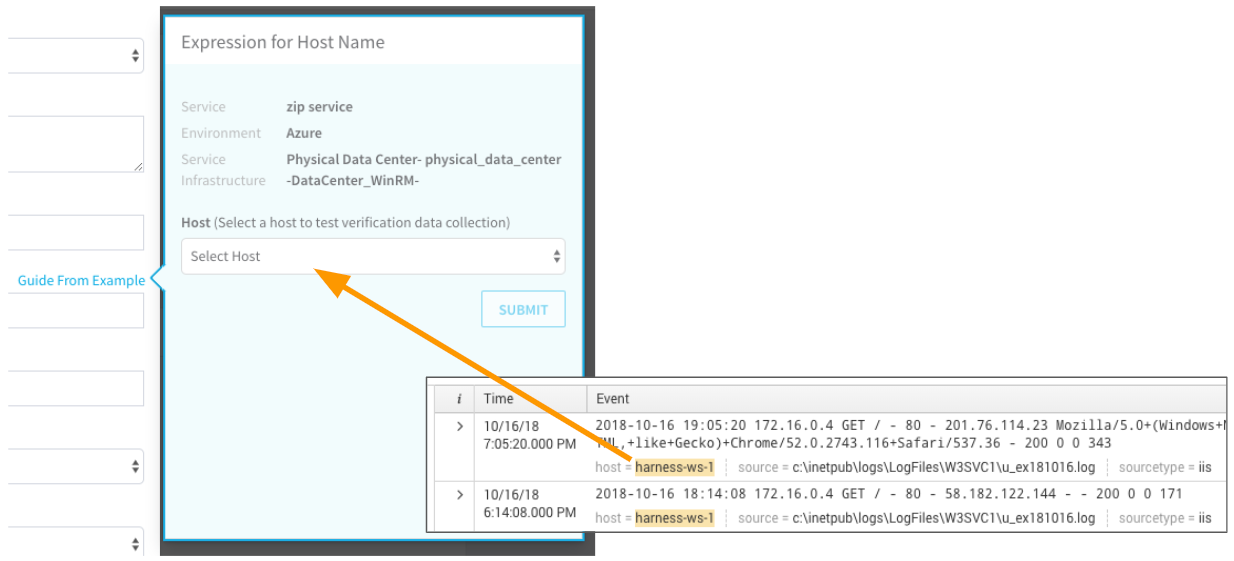
The name of the host can be seen in the event message, next to host =. The expression that you provide in the Expression for Host/Container Name field in the Harness Splunk dialog should evaluate to the name here.
You might have a different label than host, such as pod_name. You simply use the label that identifies the host or container.

In your Harness workflow Splunk dialog, click Guide From Example. The Expression for Host Name popover appears.
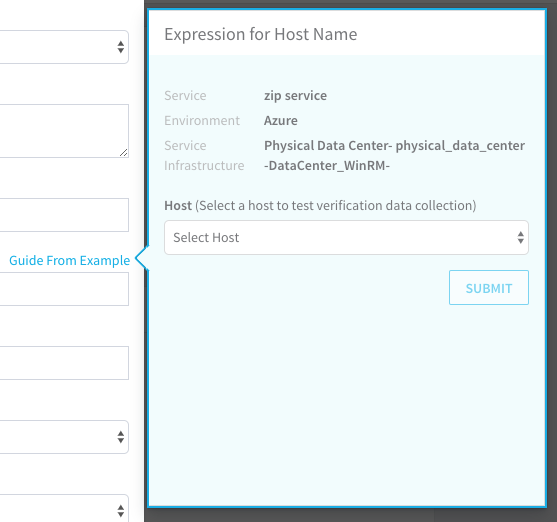
The dialog shows the service, environment, and service infrastructure used for this workflow.
In Host, click the name of the host to use when testing verification. Match the hostname from the Splunk Search to the hostname in the Expression for Host Name popover:
Click SUBMIT. The YAML for the host appears. Look for the host section.
You want to use a hostName label in the host section. Do not use a hostName label outside of that section.
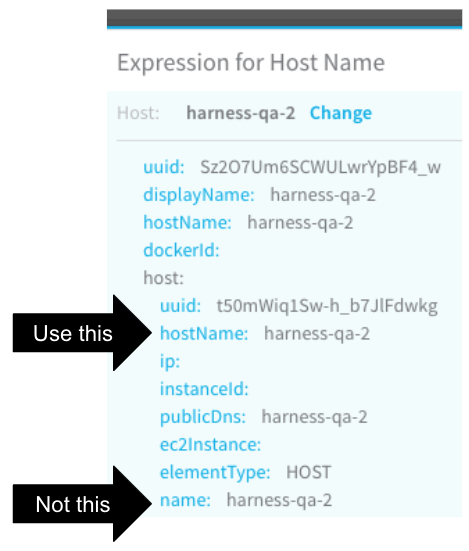
Click the hostName label. The variable name is added to the Expression for Host/Container name field.
At the bottom of the Splunk dialog, click TEST. A new Expression for Host Name popover appears.
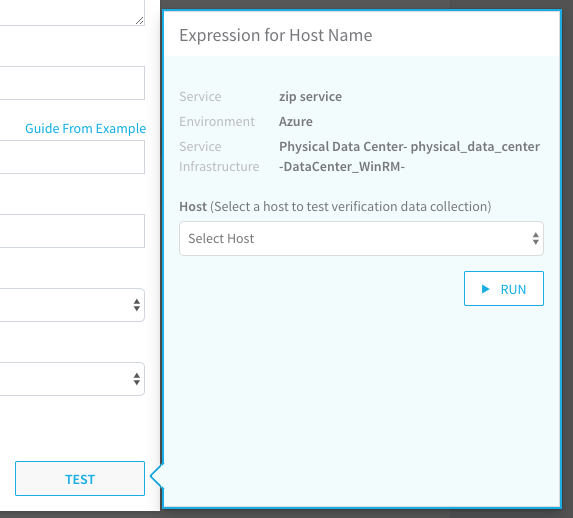
In Host, select the same host you selected last time, and then click RUN. Verification information for the host is found. In there is no verification data for the selected node, the test will display connection information only.
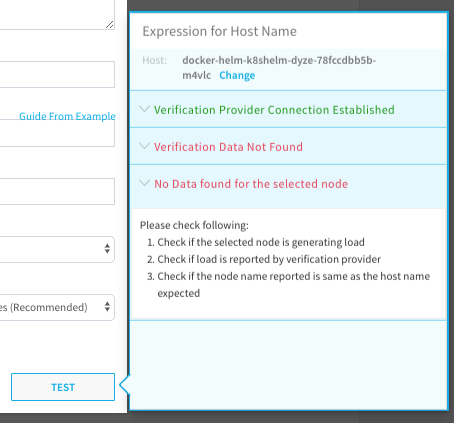
Click back in the Splunk dialog and click SUBMIT. The Splunk verification step is added to your workflow.
Option: Use Guide from Example - Kubernetes
In the Guide From Example section above we used a host example for the Expression for Host/Container name field, but if the Workflow is deploying Kubernetes, you will likely use pod or pod_name or a custom label.
For Kubernetes deployments, your Splunk account must perform Kubernetes log collection. This is typically done using Splunk Connect for Kubernetes. For information on using Splunk Connect, see Deploy Splunk Enterprise on Kubernetes on the Splunk Blog.
In addition, the Splunk fields.conf file should contain the following fields in order to search Kubernetes logs in Splunk:
 [namespace]
 INDEXED = true

 [pod]
 INDEXED = true

 [container_name]
 INDEXED = true

 [container_id]
 INDEXED = true

 [cluster_name]
 INDEXED = true
You can edit fields.conf in $SPLUNK_HOME/etc/system/local/fields.conf or in a custom app directory $SPLUNK_HOME/etc/apps/myapp/local/fields.conf.
Ensure that your Kubernetes deployment is set up to log what you need. See Logging Architecture from Kubernetes.
Review: Harness Expression Support in CV Settings
You can use expressions (${...}) for Harness built-in variables and custom Service and Workflow variables in the settings of Harness Verification Providers.
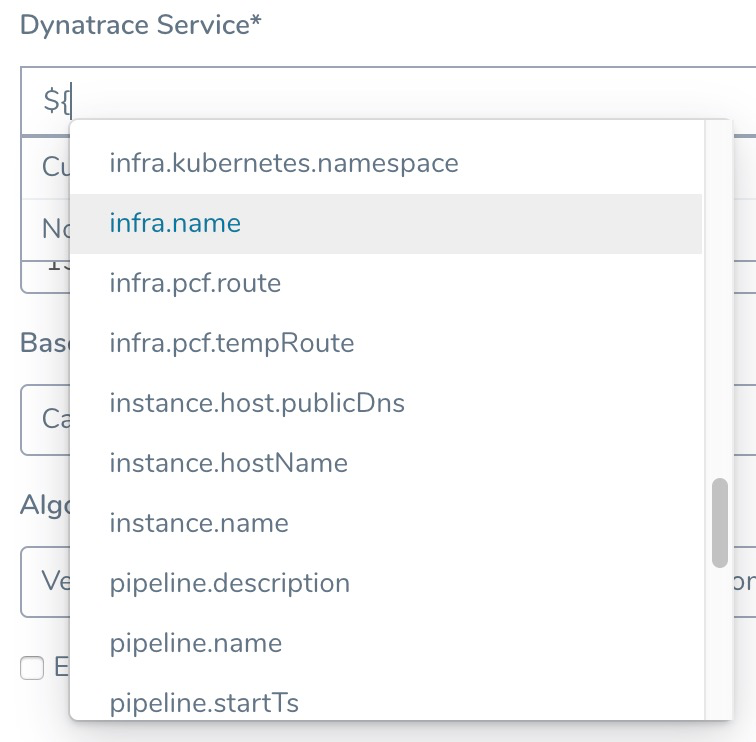
Expression support lets you template your Workflow verification steps. You can add custom expressions for settings, and then provide values for those settings at deployment runtime. Or you can use Harness built-in variable expressions and Harness will provide values at deployment runtime automatically.
Step 9: View Verification Results
Once you have deployed your workflow (or pipeline) using the Splunk verification step, you can automatically verify app performance across your deployment. For more information, see Add a Workflow and Add a Pipeline.
Workflow Verification
After you add the Splunk verification step to your workflow, the next time you deploy the workflow you will see the Splunk verification step running:
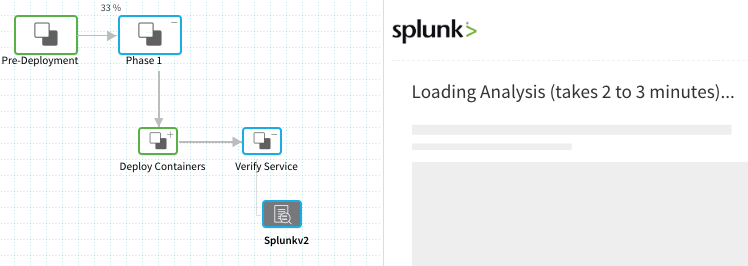
To see the results of Harness machine-learning evaluation of your Splunk verification, in your workflow or pipeline deployment you can expand the Verify Service step and then click the Splunk step.
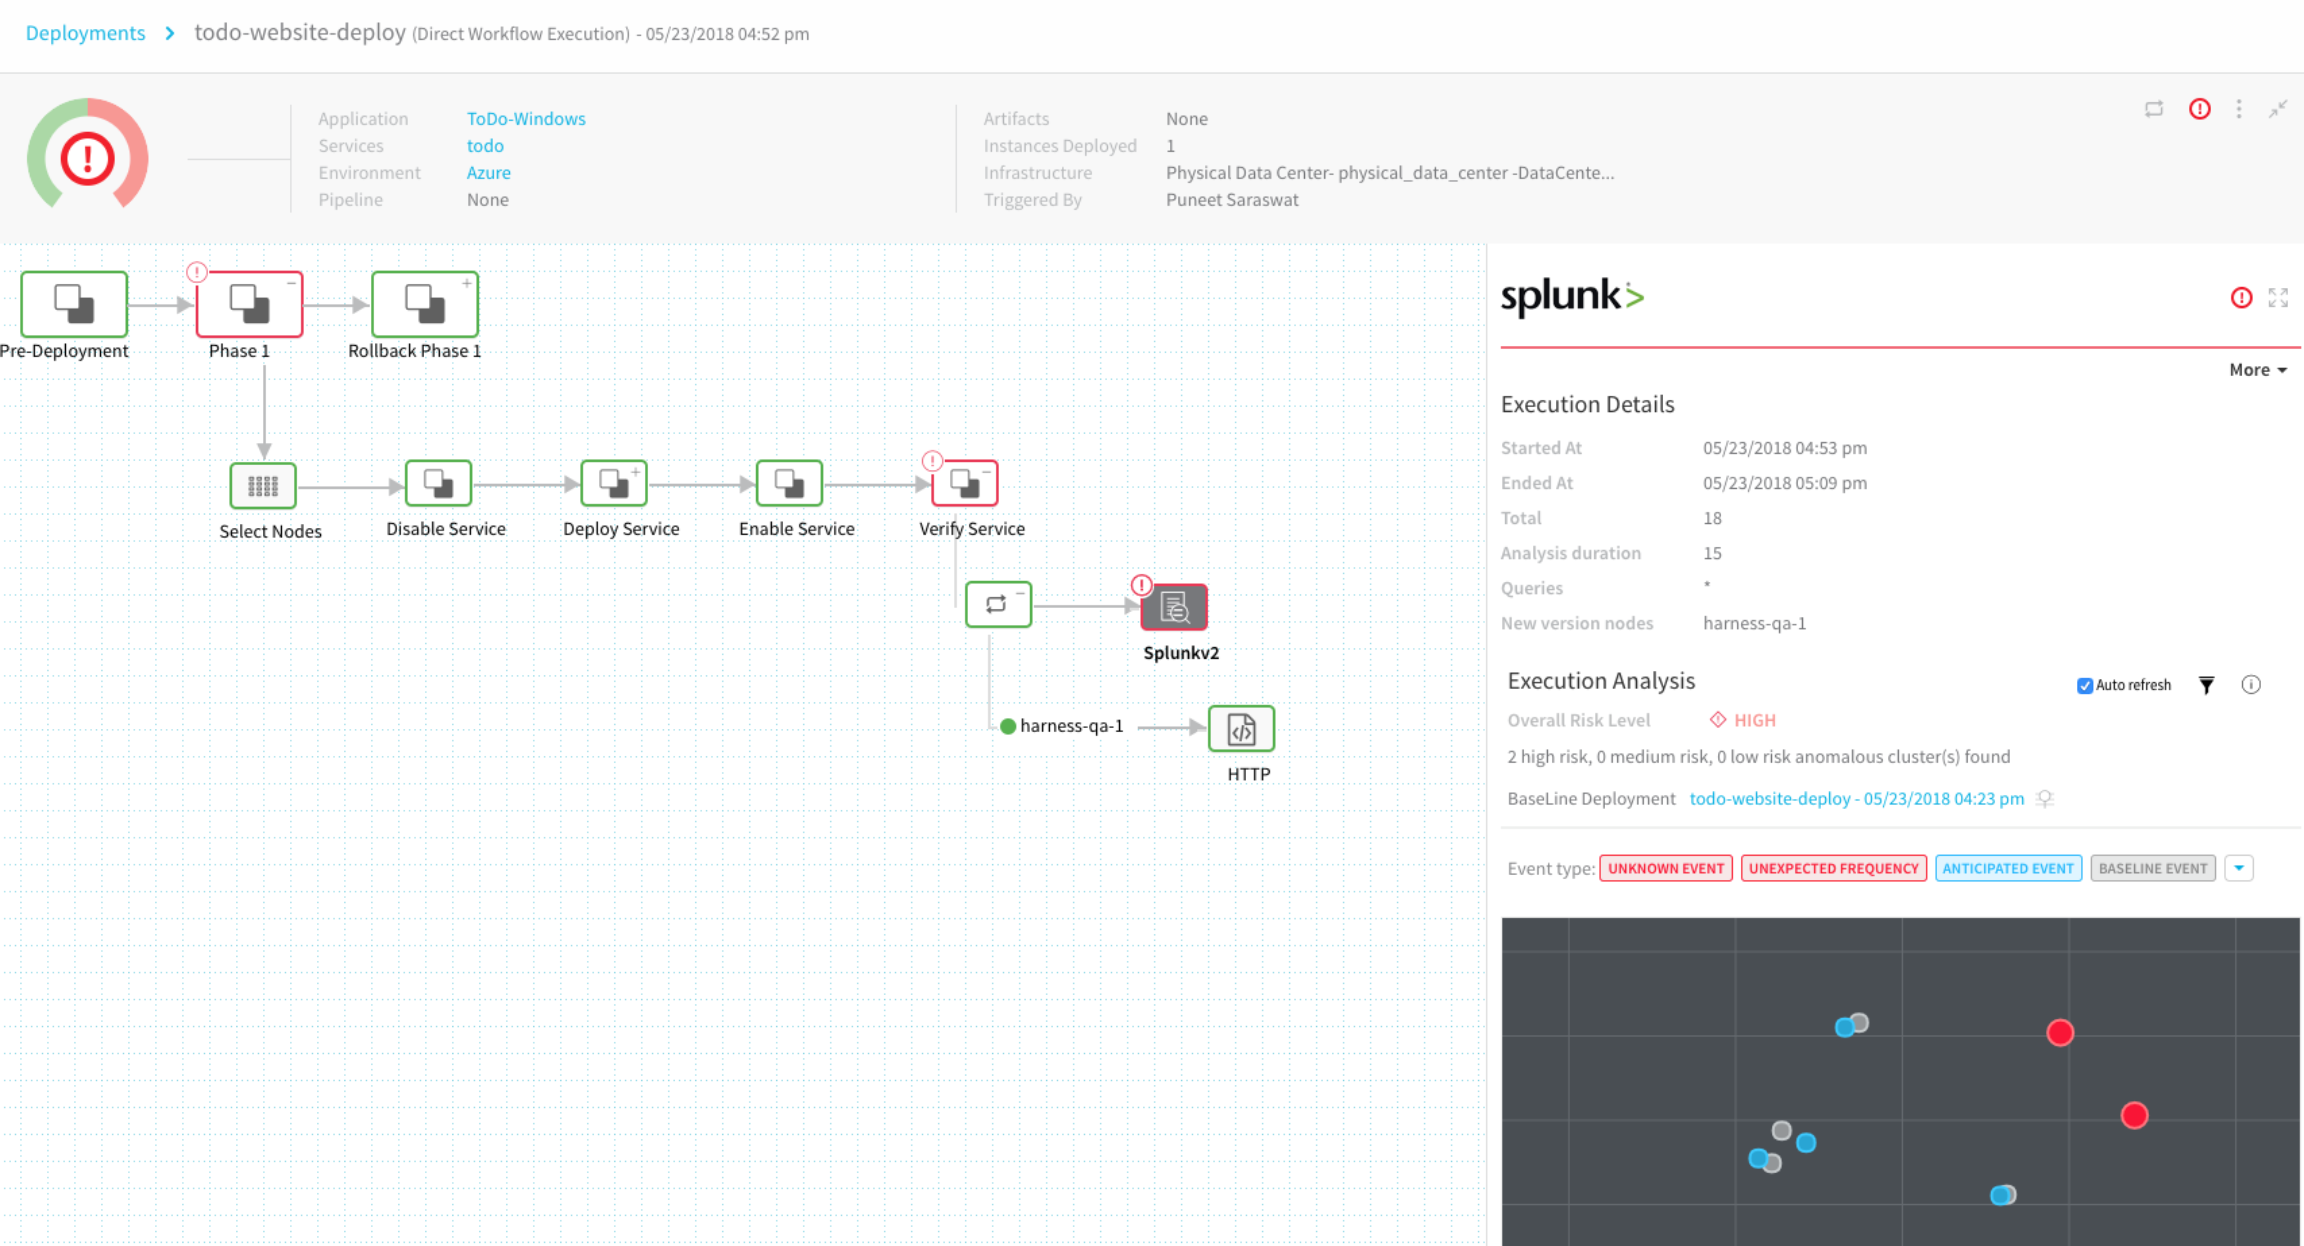
Continuous Verification
You can also see the evaluation in the Continuous Verification dashboard. The workflow verification view is for the DevOps user who developed the workflow. The Continuous Verification dashboard is where all future deployments are displayed for developers and others interested in deployment analysis.
To learn about the verification analysis features, see the following sections.
Transaction Analysis
Execution details: See the details of verification execution. Total is the total time the verification step took, and Analysis duration is how long the analysis took.
Risk level analysis: Get an overall risk level and view the cluster chart to see events.
Transaction-level summary: See a summary of each transaction with the query string, error values comparison, and a risk analysis summary.
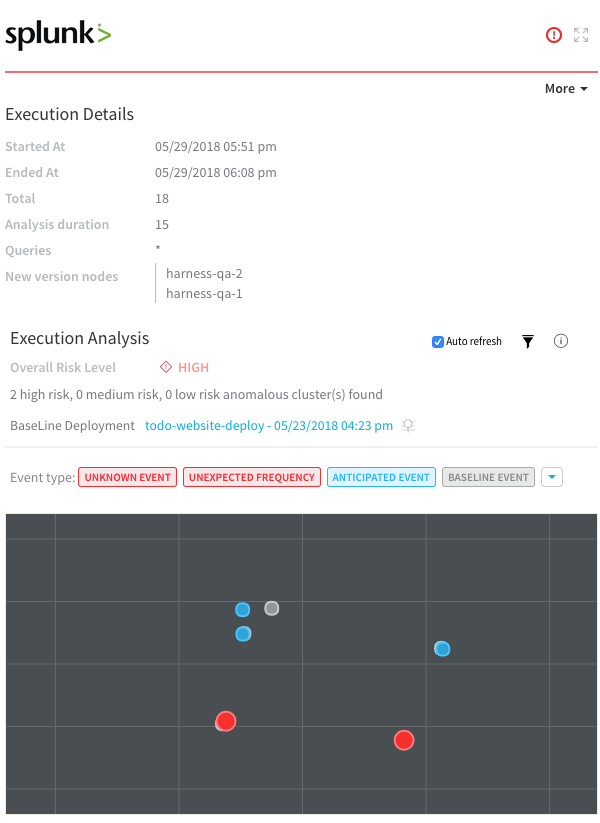
Execution Analysis
Event type: Filter cluster chart events by Unknown Event, Unexpected Frequency, Anticipated Event, Baseline Event, and Ignore Event.
Cluster chart: View the chart to see how the selected event contrast. Click each event to see its log details.
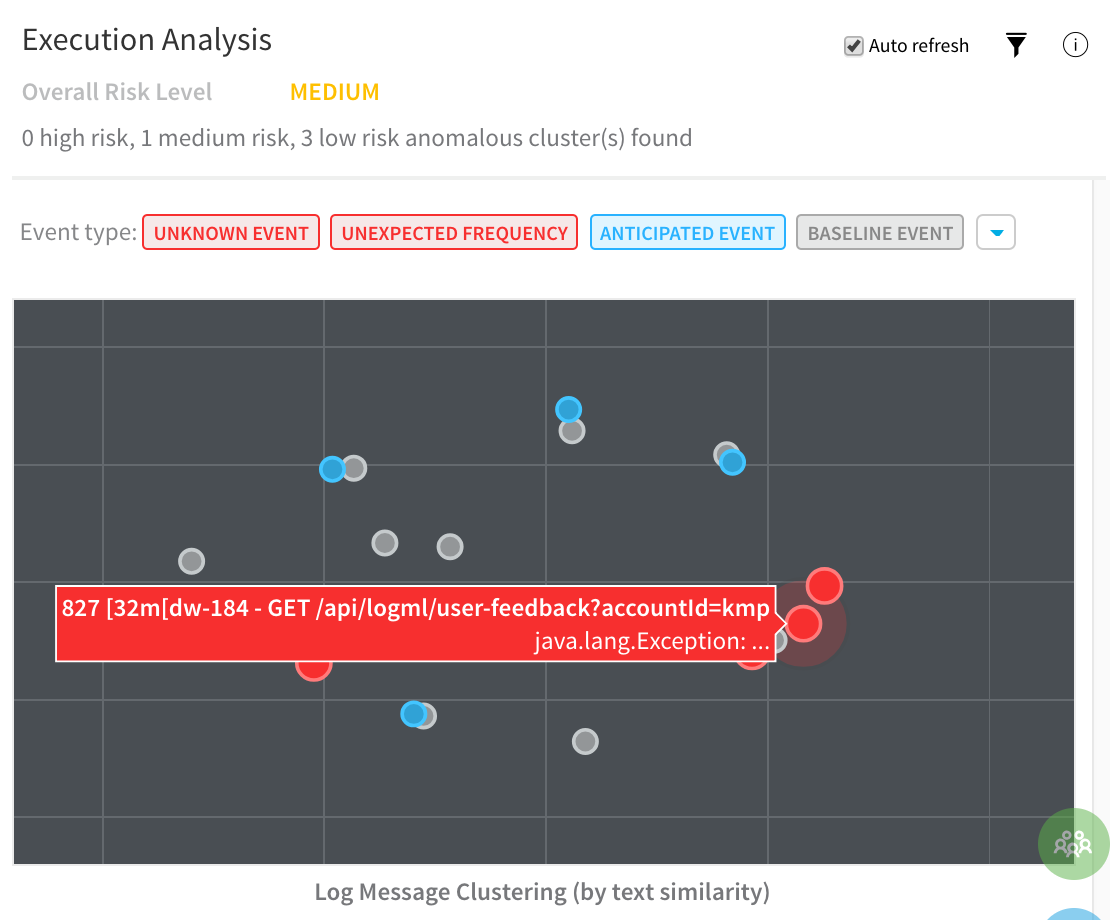
Event Management
Event-level analysis: See the threat level for each event captured.
Tune event capture: Remove events from analysis at the service, workflow, execution, or overall level.
Event distribution: Click the chart icon to see an event distribution including the measured data, baseline data, and event frequency.
