Monitor Applications 24/7 with Bugsnag
Harness 24/7 Service Guard monitors your live applications, catching problems that surface minutes or hours following deployment. For more information, see 24/7 Service Guard Overview.
You can add your Bugsnag monitoring to Harness 24/7 Service Guard in your Harness Application Environment. For a setup overview, see .
This section assumes you have a Harness Application set up and containing a Service and Environment. For steps on setting up a Harness Application, see Application Checklist.
Before You Begin
- See the Bugsnag Verification Overview.
- See Connect to Bugsnag.
Step 1: Set Up 24/7 Service Guard for Bugsnag
To set up 24/7 Service Guard for Bugsnag, do the following:
Ensure that you have added Bugsnag as a Harness Verification Provider, as described in Connect to Bugsnag.
In your Harness Application, ensure that you have added a Service, as described in Services. For 24/7 Service Guard, you do not need to add an Artifact Source to the Service, or configure its settings. You simply need to create a Service and name it. It will represent your application for 24/7 Service Guard.
In your Harness Application, click Environments.
In Environments, ensure that you have added an Environment for the Service you added. For steps on adding an Environment, see Environments.
Click the Environment for your Service. Typically, the Environment Type is Production.
In the Environment page, locate 24/7 Service Guard.
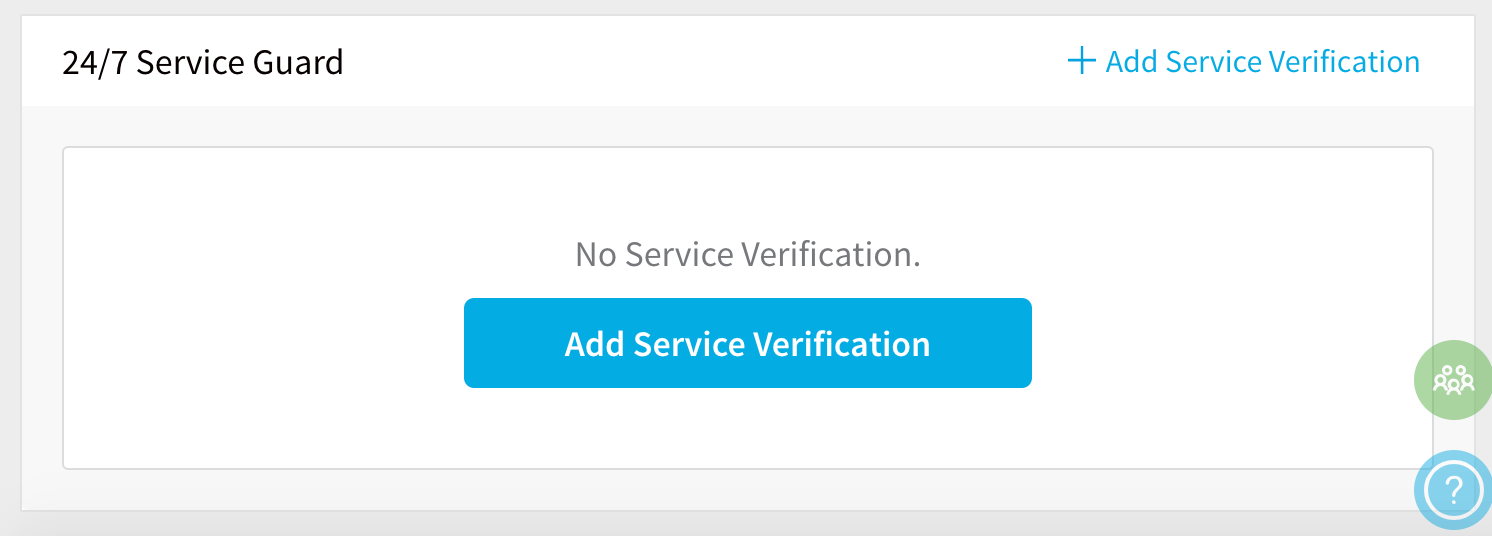
In 24/7 Service Guard, click Add Service Verification, and then click Bugsnag.
Fill out the dialog. The Bugsnag dialog has the following fields.
For 24/7 Service Guard, the queries you define to collect logs are specific to the application or service you want monitored. Verification is application/service level. This is unlike Workflows, where verification is performed at the host/node/pod level.
Step 2: Display Name
The name that will identify this service on the Continuous Verification dashboard. Use a name that indicates the environment and monitoring tool, such as Bugsnag.
Step 3: Service
The Harness Service to monitor with 24/7 Service Guard.
Step 4: Bugsnag Server
Select the Bugsnag verification provider you added to Harness, as described above. Harness will immediately use the connection to obtain organization and project information from Bugsnag.
Step 5: Organization ID
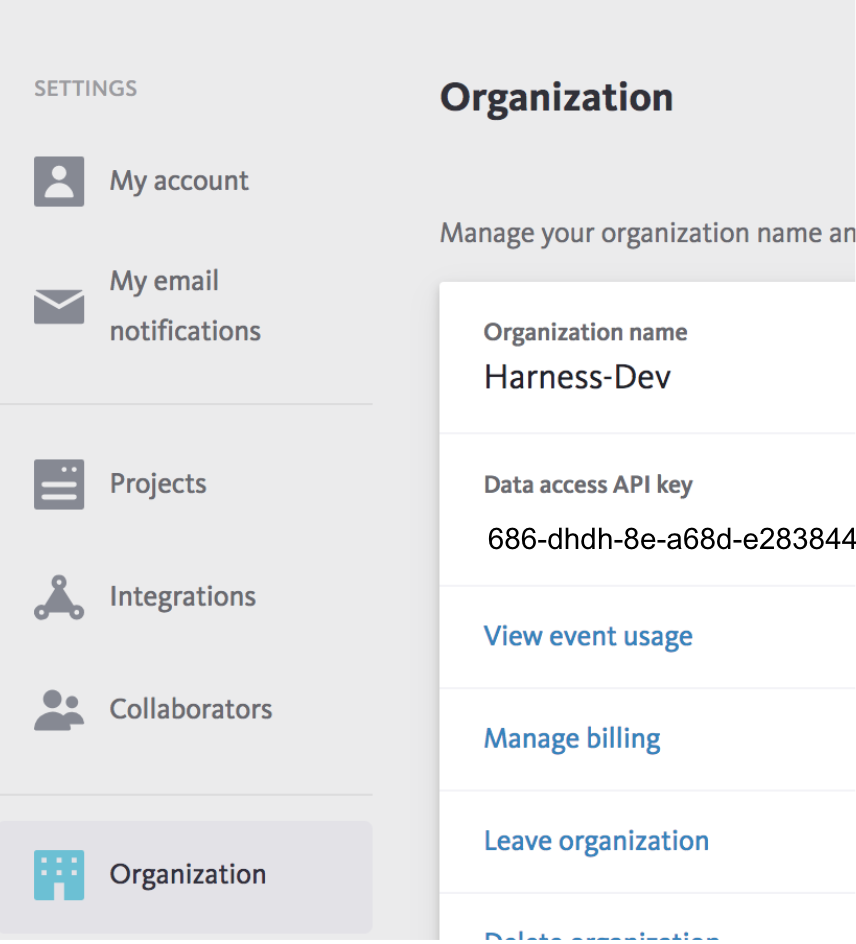
Select the Organization ID for your Bugsnag account. In Bugsnag, this is the Organization name in the account's Organization page:
Step 6: Project ID
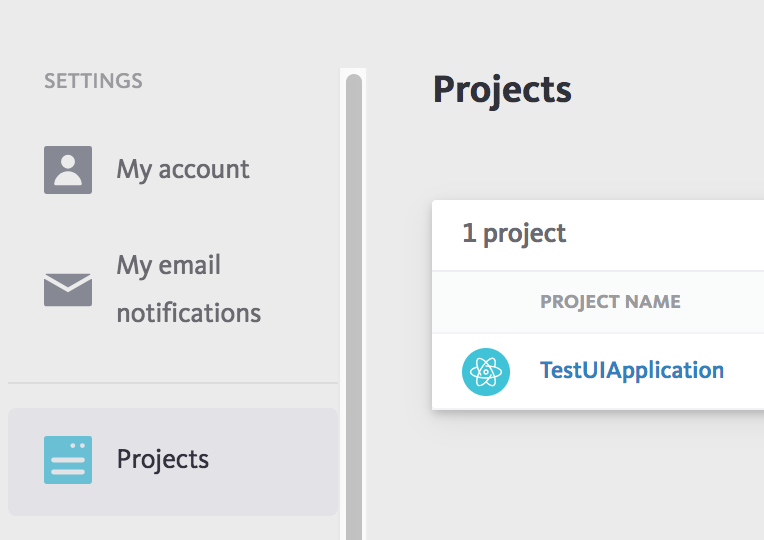
Select the Project ID for the Bugsnag project you want to use. In Bugsnag, this is the Project Name in the Projects page:
[ ](./static/2-24-7-service-guard-for-bugsnag-29.png
Step 7: Release Stage
Enter the Bugsnag release stage, if necessary.
Step 8: Search Keywords
The keywords to search, such as *exception*.
Step 9: Browser Application
Click the checkbox to have Harness ignore host/node events and focus on the browser events Bugsnag captures.
Step 10: Baseline
Select the baseline time unit for monitoring. For example, if you select For 4 hours, Harness will collect the logs for the last 4 hours as the baseline for comparisons with future logs. If you select Custom Range you can enter a Start Time and End Time.

