Verify Deployments with Bugsnag
The following procedure describes how to add Bugsnag as a verification step in a Harness workflow. For more information about workflows, see Add a Workflow.
Once you run a deployment and Bugsnag preforms verification, Harness' machine-learning verification analysis will assess the risk level of the deployment.
In order to obtain the useful comparison data, the verification provider should be added to your workflow after you have run at least one successful deployment.
Before You Begin
- See the Bugsnag Verification Overview.
- See Connect to Bugsnag.
Visual Summary
Here's an example Bugsnag deployment verification configuration.

Step 1: Set Up the Deployment Verification
To verify your deployment with Bugsnag, do the following:
Ensure that you have added Bugsnag as a verification provider, as described in Connect to Bugsnag.
In your workflow, under Verify Service, click Add Verification.
In the resulting Add Step settings, select Log Analysis > Bugsnag.
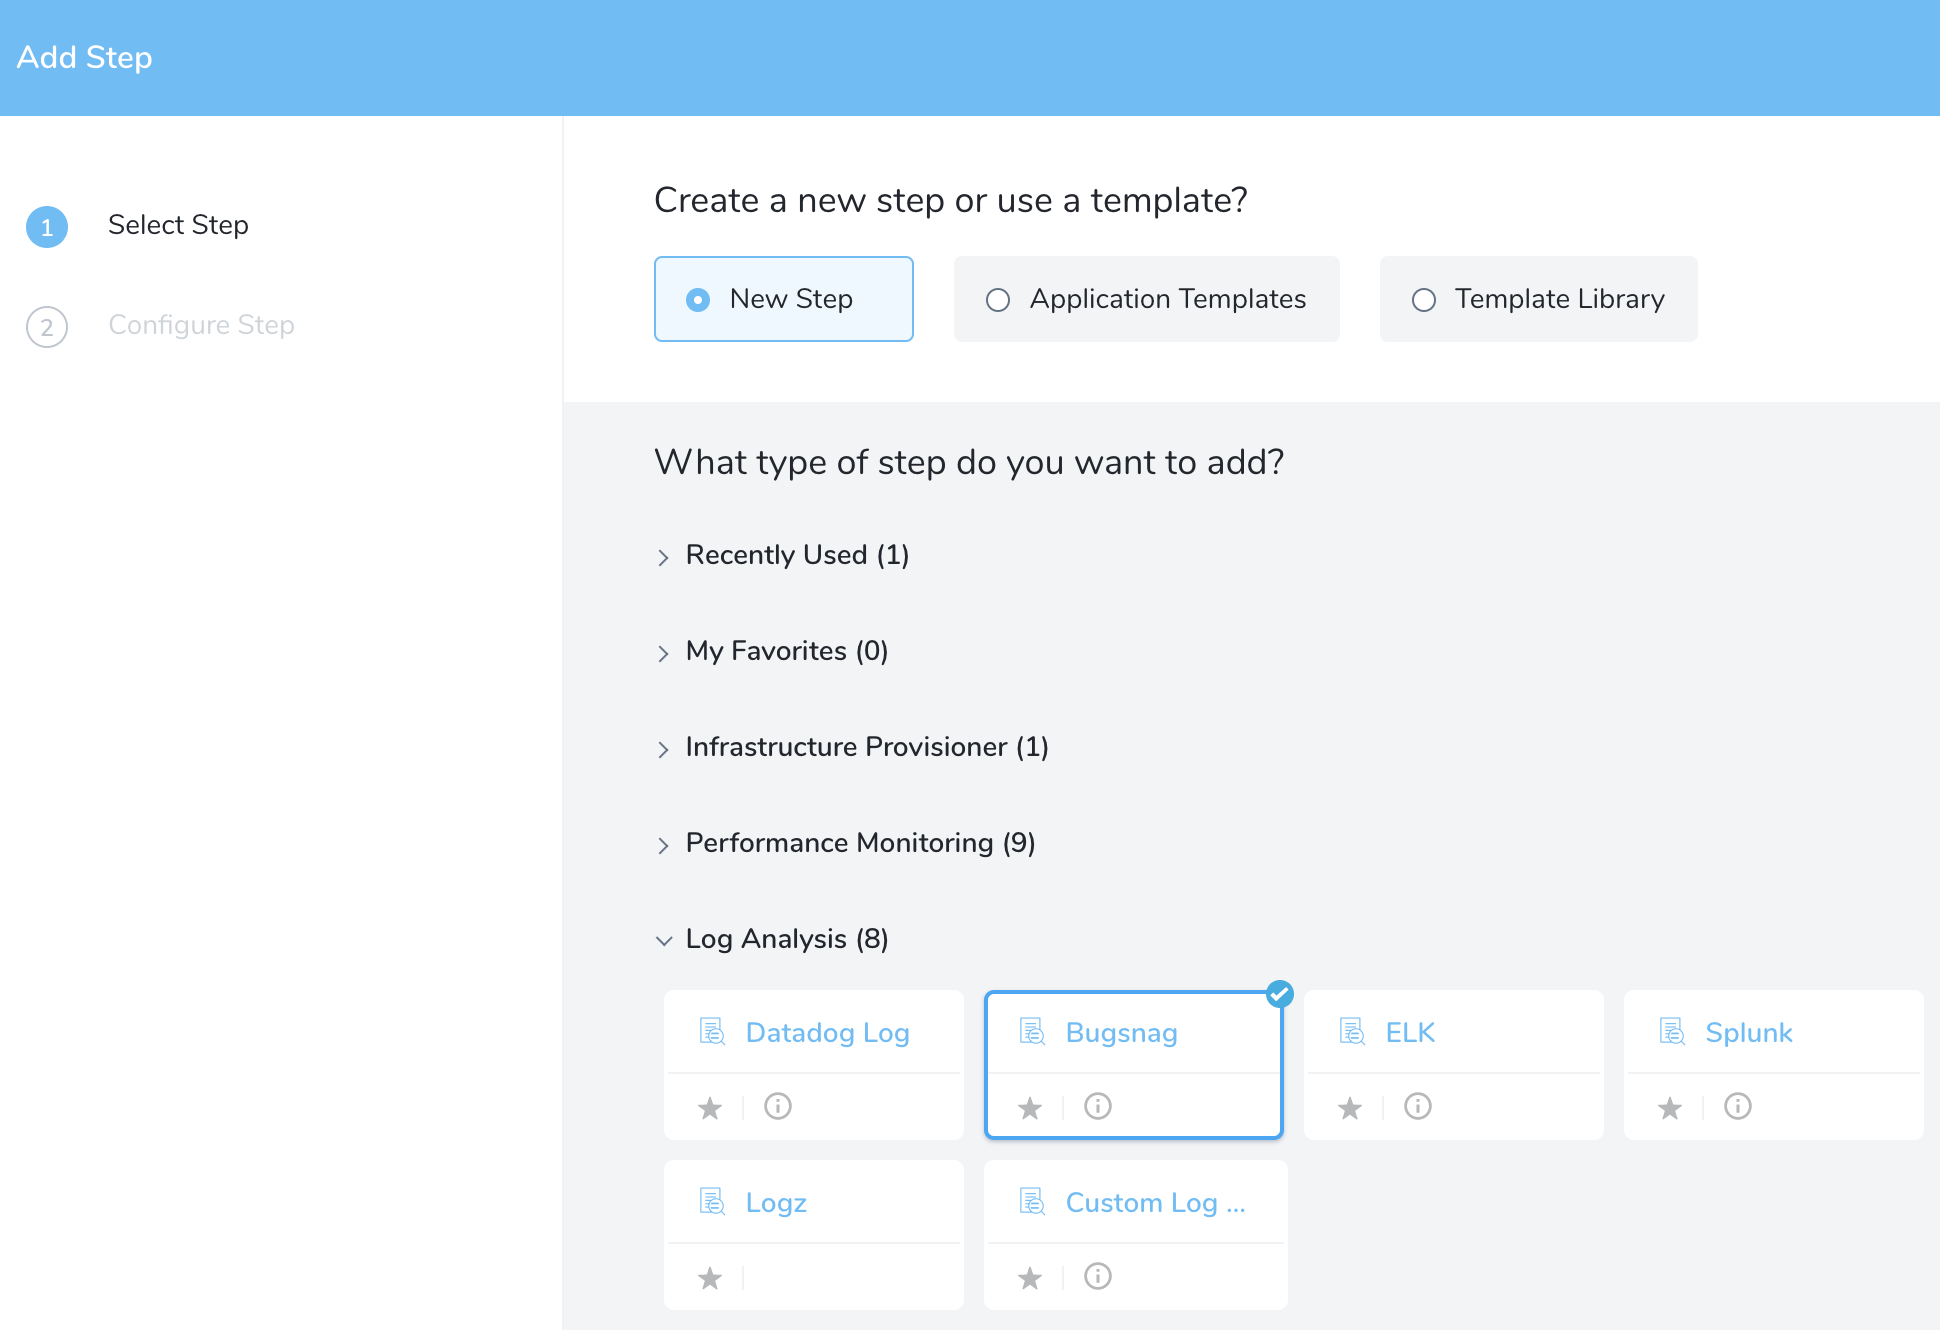
Click Next. The Configure Bugsnag settings appear.
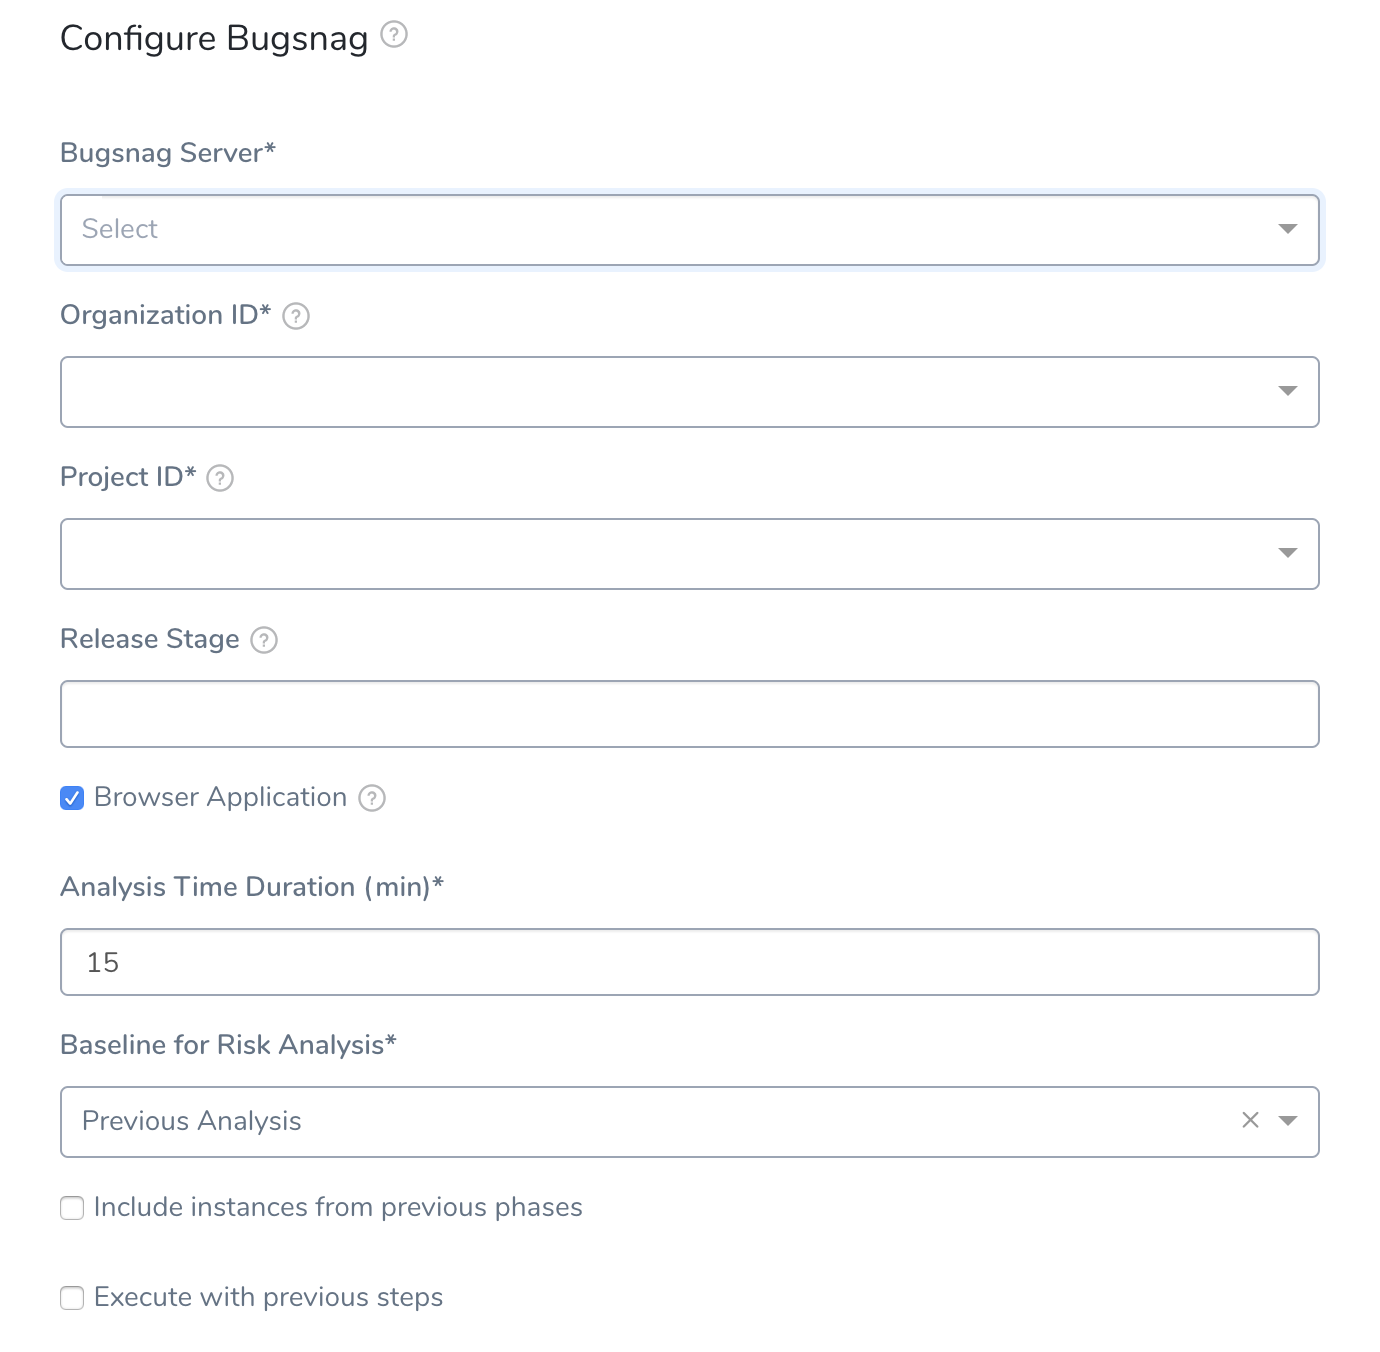
These settings include the following fields.
Step 2: Bugsnag Server
Select the Bugsnag verification provider you added to Harness, as described above. Harness will immediately use the connection to obtain organization and project information from Bugsnag.
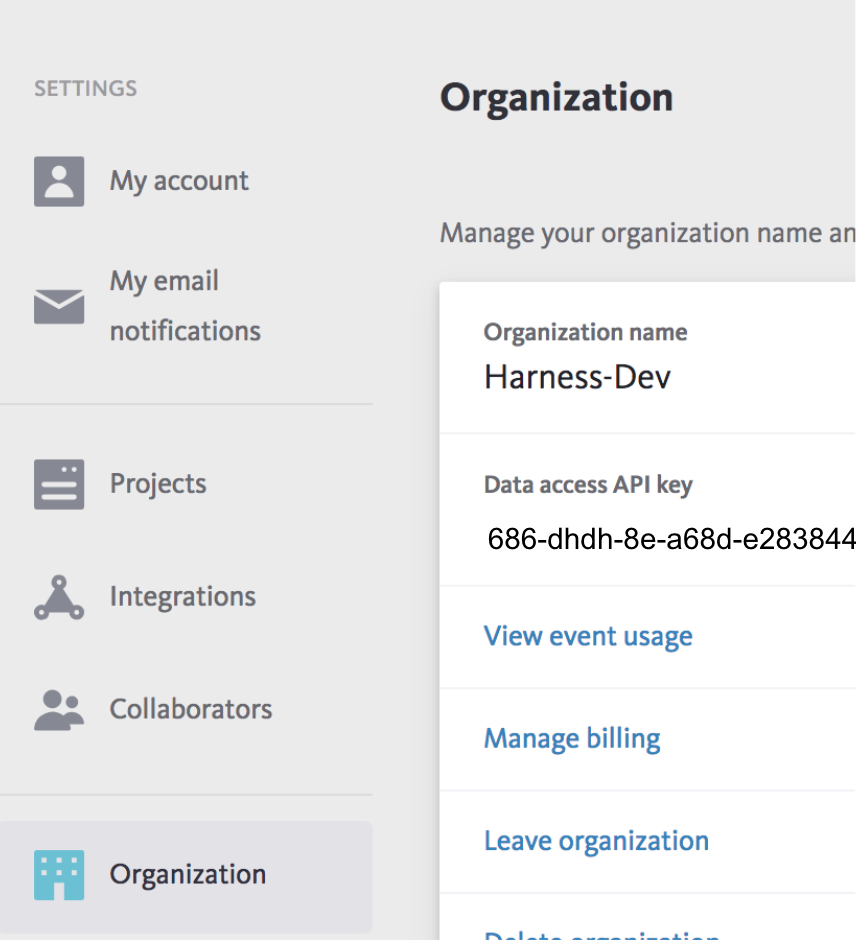
Step 3: Organization ID
Select the Organization ID for your Bugsnag account. In Bugsnag, this is the Organization name in the account's Organization page:
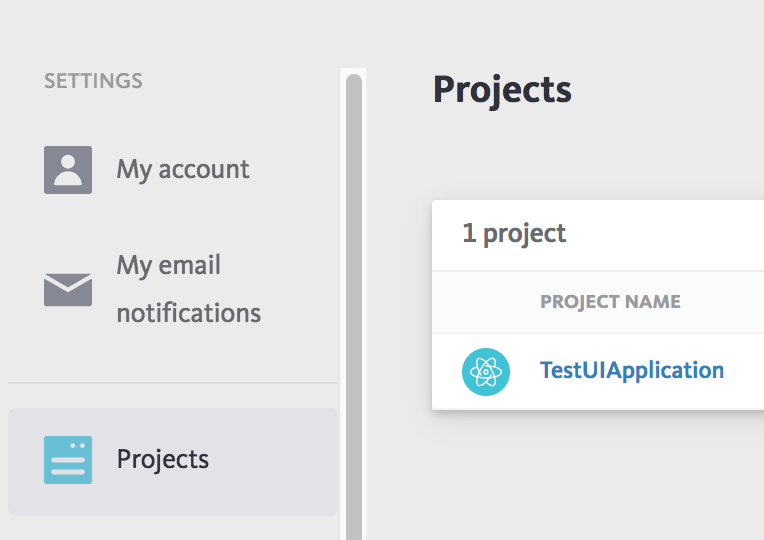
Step 4: Project ID
Select the Project ID for the Bugsnag project you want to use. In Bugsnag, this is the Project Name in the Projects page:
Step 5: Release Stage
Enter the Bugsnag release stage, if necessary.
Step 6: Browser Application
Click the checkbox to have Harness ignore host/node deployment events and focus on the browser events Bugsnag captures.
Step 7: Expression for Host/Container name
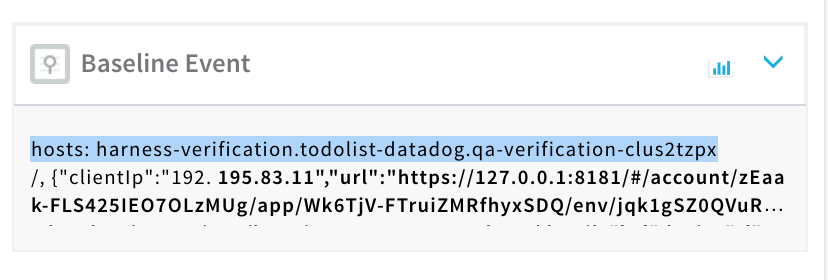
If you do not enable the Browser Application checkbox, Harness will use the host/node/container event data Bugsnag captures. Add a variable that evaluates to the hostname value in the host field of event messages. For example, in a Bugsnag message in a Harness deployment verification, if you look at a event message, you will see a hosts field:
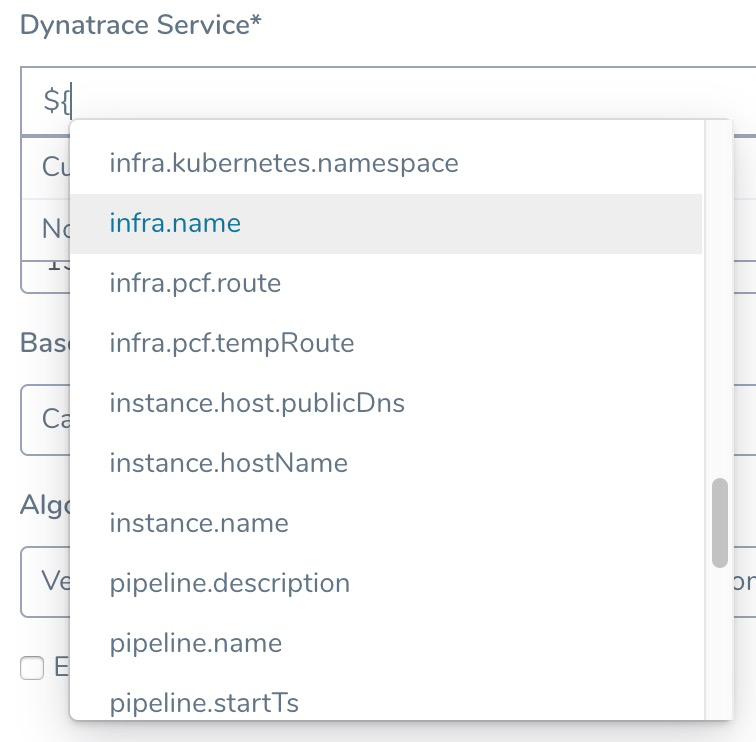
Next, look in the JSON for the host/container/pod in the deployment environment and identify the label containing the same hostname. The path to that label is what the expression should be in Expression for Host/Container name. The default variable is ${instance.host.hostName}. In most cases, this expression will work.
For AWS EC2 hostnames, use the expression ${instance.hostName}.
Step 8: Analysis Time Duration
Set the duration for the verification step. If a verification step exceeds the value, the workflow Failure Strategy is triggered. For example, if the Failure Strategy is Ignore, then the verification state is marked Failed but the workflow execution continues.
See CV Strategies, Tuning, and Best Practices.
Step 9: Baseline for Risk Analysis
See CV Strategies, Tuning, and Best Practices.
Step 10: Include instances from previous phases
If you are using this verification step in a multi-phase deployment, select this checkbox to include instances used in previous phases when collecting data. Do not apply this setting to the first phase in a multi-phase deployment.
Step 11: Execute with previous steps
Check this checkbox to run this verification step in parallel with the previous steps in Verify Service.
Review: Harness Expression Support in CV Settings
You can use expressions (${...}) for Harness built-in variables and custom Service and Workflow variables in the settings of Harness Verification Providers.
Expression support lets you template your Workflow verification steps. You can add custom expressions for settings, and then provide values for those settings at deployment runtime. Or you can use Harness built-in variable expressions and Harness will provide values at deployment runtime automatically.
Step 12: View Verification Results
Once you have deployed your workflow (or pipeline) using the Bugsnag verification step, you can automatically verify cloud application and infrastructure performance across your deployment. For more information, see Add a Workflow and Add a Pipeline.
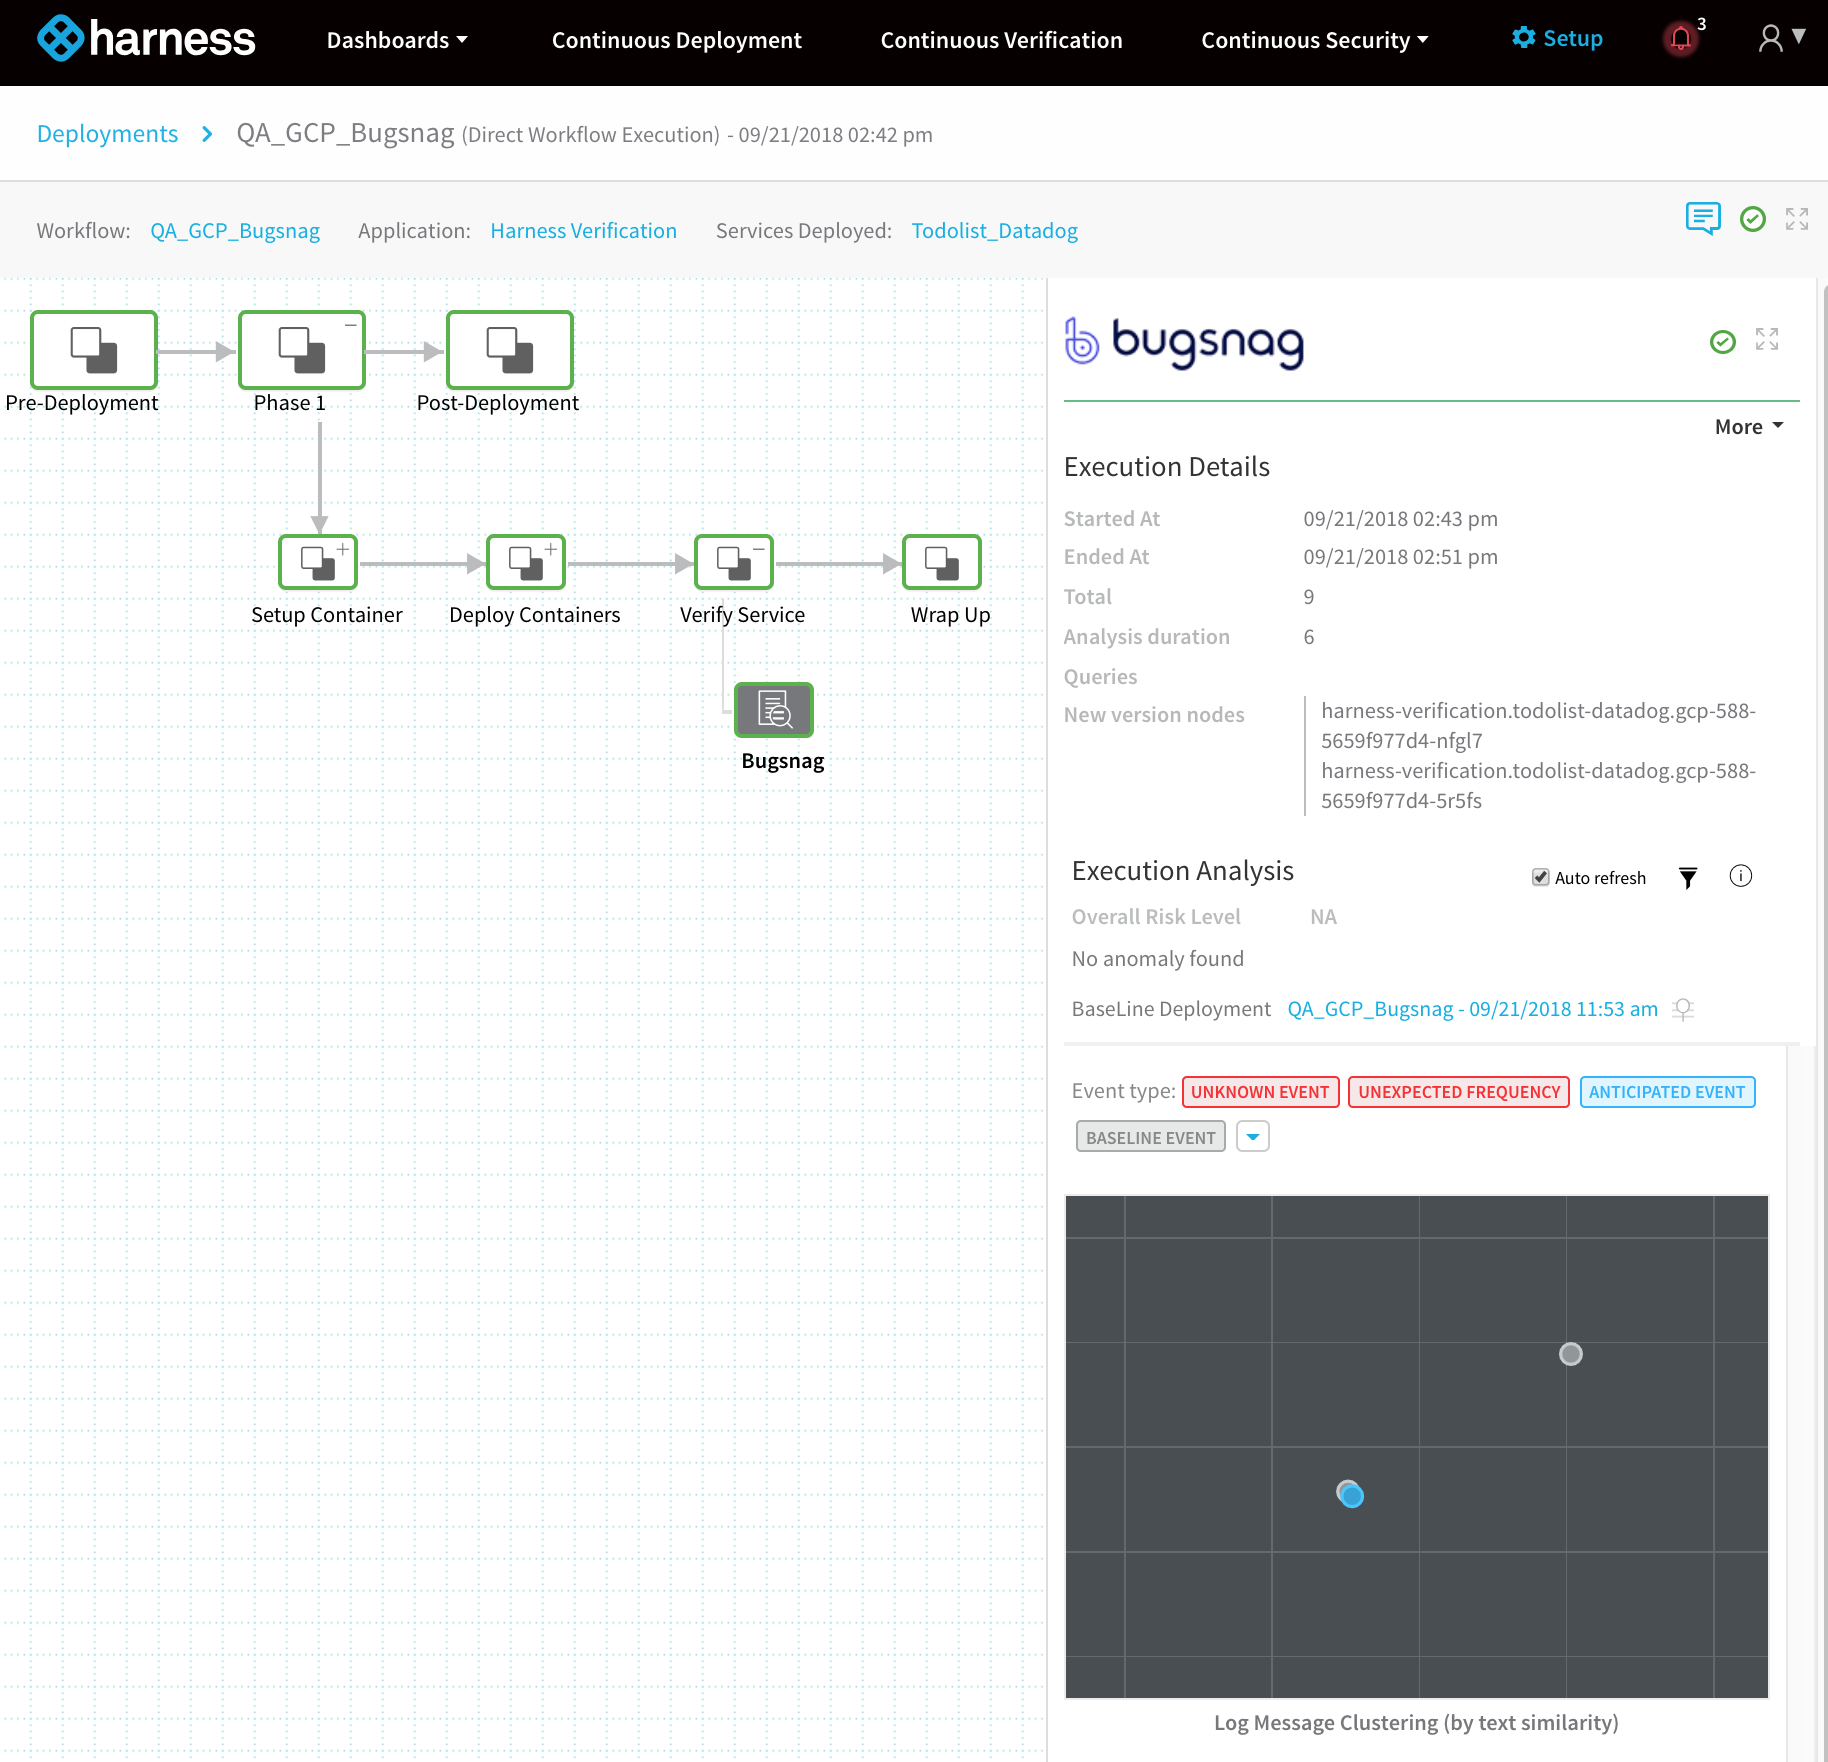
Workflow Verification
To see the results of Harness machine-learning evaluation of your Bugsnag verification, in your workflow or pipeline deployment you can expand the Verify Service step and then click the Bugsnag step.
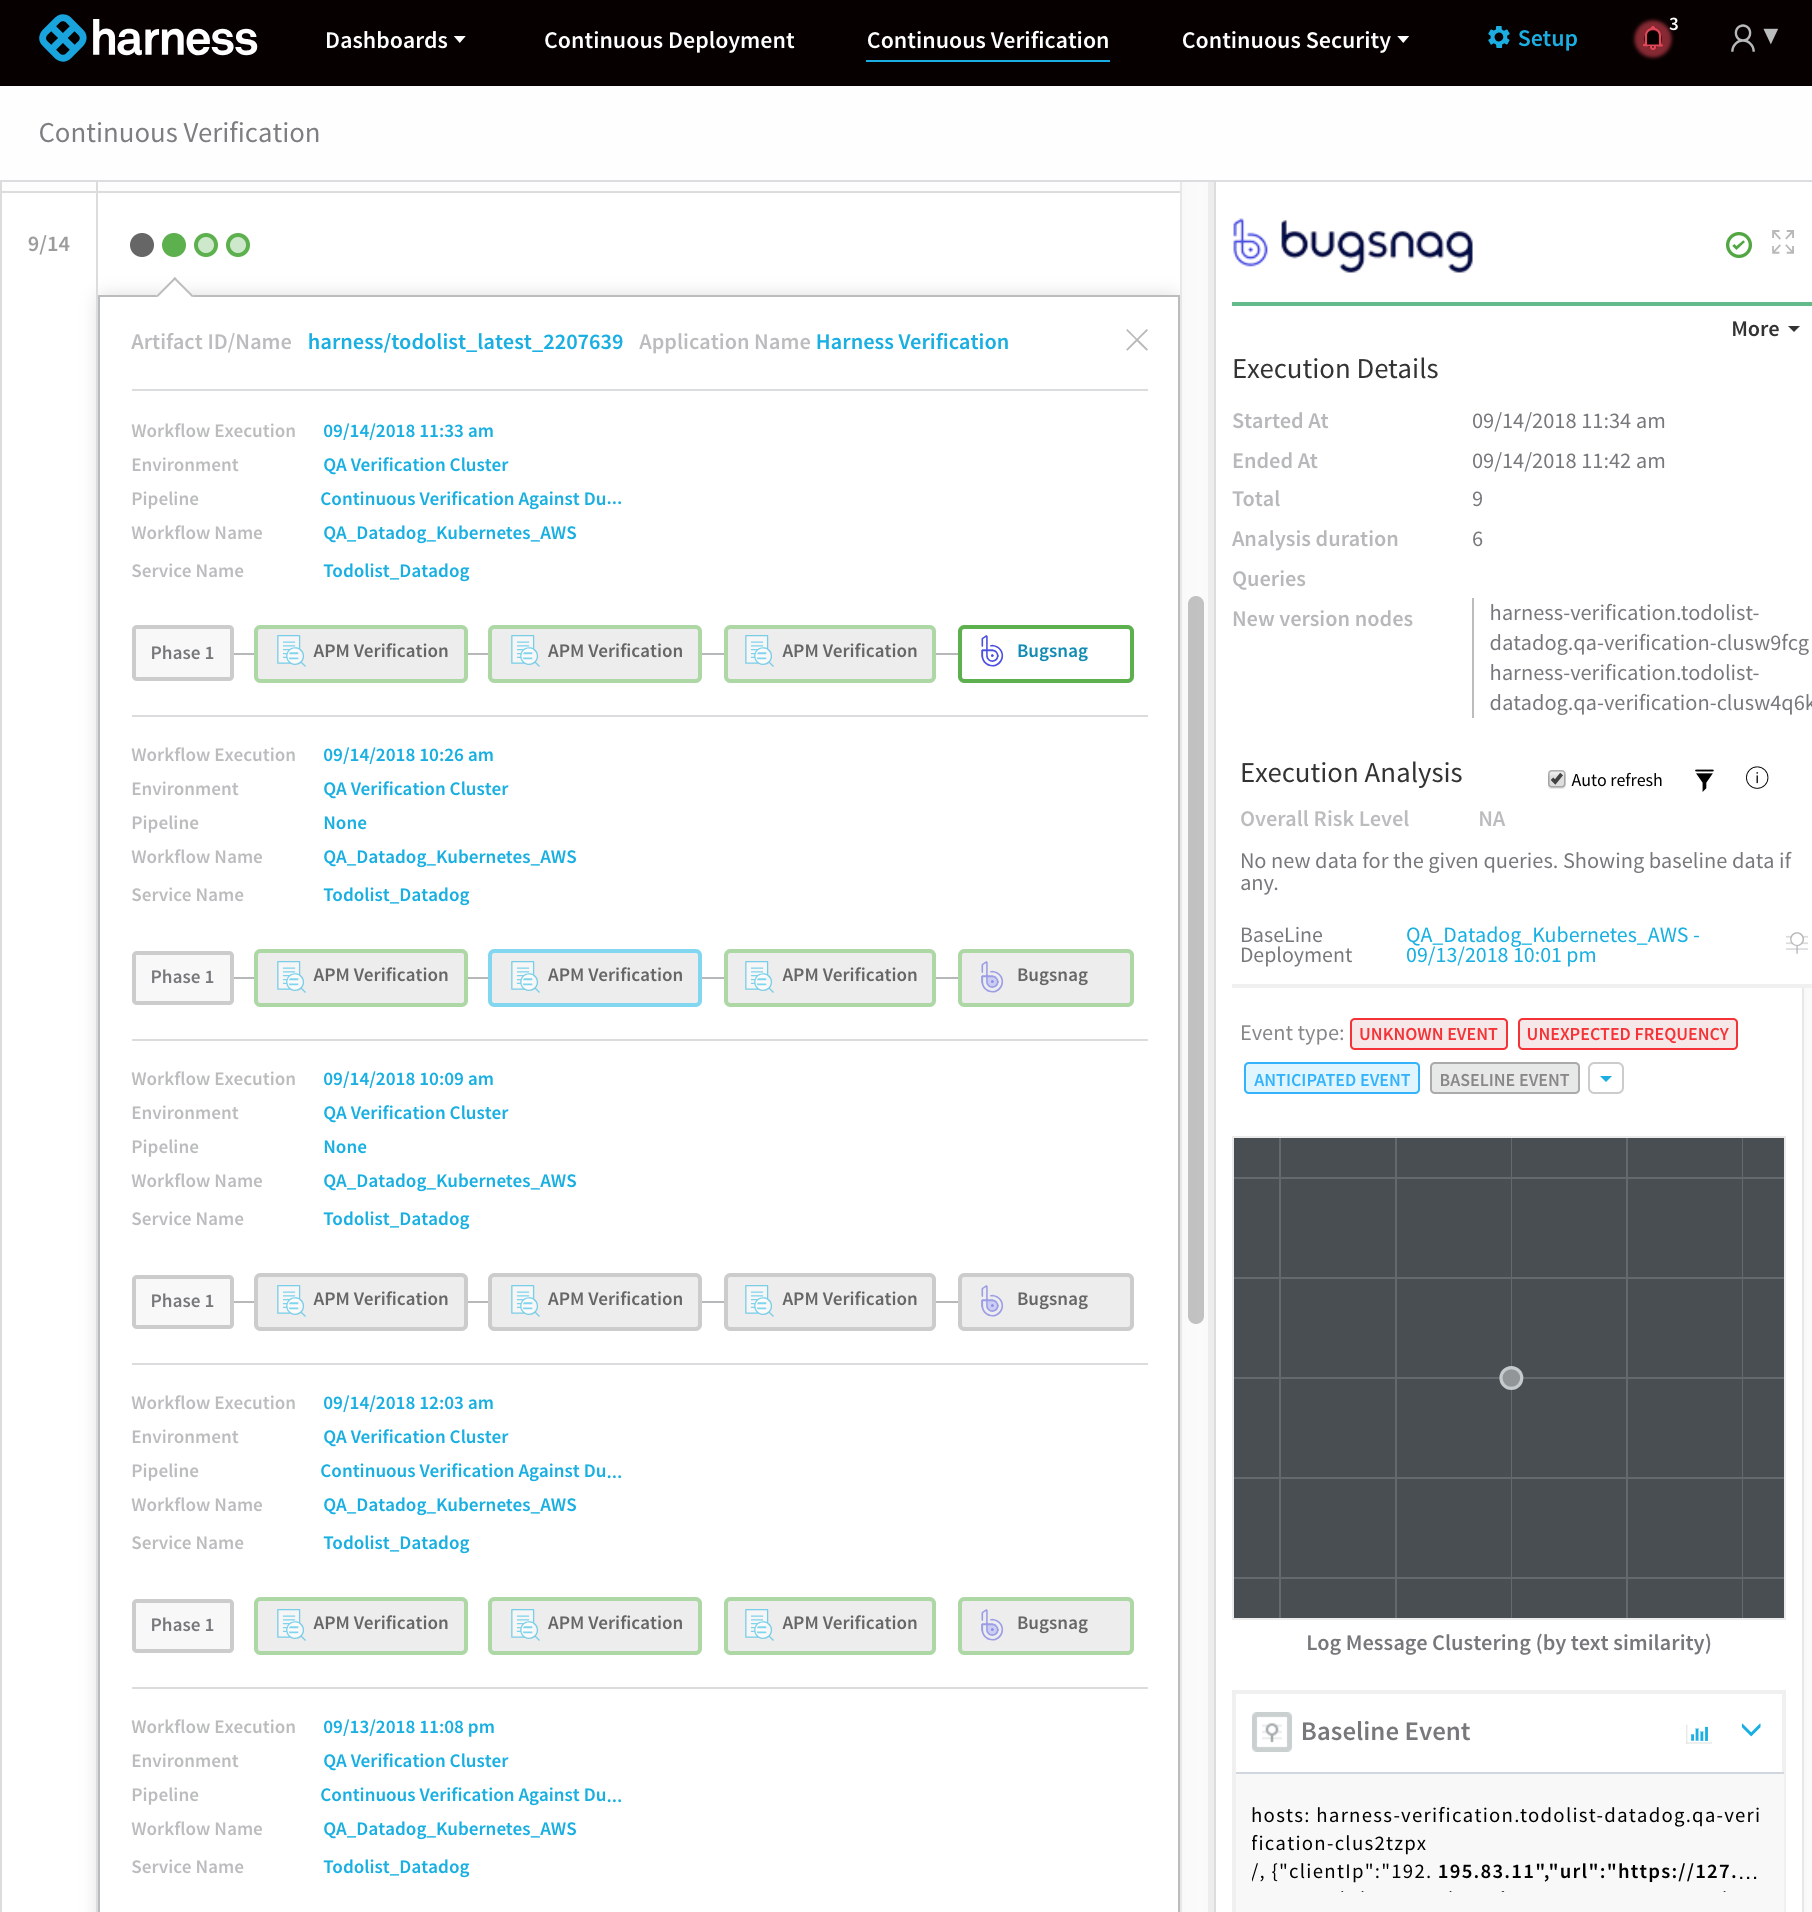
Continuous Verification
You can also see the evaluation in the Continuous Verification dashboard. The workflow verification view is for the DevOps user who developed the workflow. The Continuous Verification dashboard is where all future deployments are displayed for developers and others interested in deployment analysis.
To learn about the verification analysis features, see the following sections.
Deployments
- Deployment info: See the verification analysis for each deployment, with information on its service, environment, pipeline, and workflows.
- Verification phases and providers: See the vertfication phases for each vertfication provider. Click each provider for logs and analysis.
- Verification timeline: See when each deployment and verification was performed. |
Transaction Analysis
- Execution details: See the details of verification execution. Total is the total time the verification step took, and Analysis duration is how long the analysis took.
- Risk level analysis: Get an overall risk level and view the cluster chart to see events.
- Transaction-level summary: See a summary of each transaction with the query string, error values comparison, and a risk analysis summary.
Execution Analysis
- Event type: Filter cluster chart events by Unknown Event, Unexpected Frequency, Anticipated Event, Baseline Event, and Ignore Event.
- Cluster chart: View the chart to see how the selected event contrast. Click each event to see its log details. |
Event Management
- Event-level analysis: See the threat level for each event captured.
- Tune event capture: Remove events from analysis at the service, workflow, execution, or overall level.
- Event distribution: Click the chart icon to see an event distribution including the measured data, baseline data, and event frequency.