Export Deployment Logs
This content is for Harness FirstGen. For information about delegates in Harness NextGen, see Delegate overview. Large enterprises are highly regulated and auditing the deployments happening in their environments is critical. These audits might take into account deployment information across years.
Harness provides advanced auditing in the Harness Manager, as described in Audit Trail, and deployment information in the Deployments page and dashboards, but large enterprises want to save deployment information to their centralized archives for years to come.
Harness includes deployment exports to serve this need. Deployment exports give you control over what is stored and audited and allows you to save deployment information in your archives.
Harness also provides an API for deployment exports, enabling you to extract logs programmatically.
Before You Begin
Familiarize yourself with the different ways Harness displays deployment information:
Limitations
- Exports are limited to 25 exports per day.
- There is a limit of 1000 deployments per export. You can use the Deployments page filtering to control how many deployments are in each log.
- Anyone can use the export file download link from Harness to download the logs. There is no authentication. You can specify the Harness User Group to notify in Harness Manager and in the API (
userGroupIds). - Export log download links expire 72 hours after they are generated.
- There is a hard limit of 25MB for logs produced by 1 Workflow step. Logs beyond this limit will be skipped and not available for download as well.
Review: Export Process
There are two options for exporting deployment logs from Harness:
- Harness Manager
- Harness API
In both options, the process is:
- Once you export logs from Harness, Harness is notified of your request.
- Harness processes your request in the background.
- Once Harness is finished:
- If you are using the Harness Manager: Harness sends you an email or Slack message with a link to your log file. You can specify the Harness User Group to notify.
- If you using the Harness API, the
statusfield is updated withREADY.
- You can then download the log archive file.
Option 1: Export Using the Harness Manager
In the Harness Manager Deployments page, you filter all deployments to get the exact deployments you want to export, specify which Harness User Groups to notify when Harness has the export file, and then export the logs.
Next, you check email or Slack to get the download link.
Filter Deployments
In the Harness Manager, filter the deployment logs before exporting. This ensures that you have exactly the deployment logs you want.
- In Deployments, click the filter button to show the filter settings.
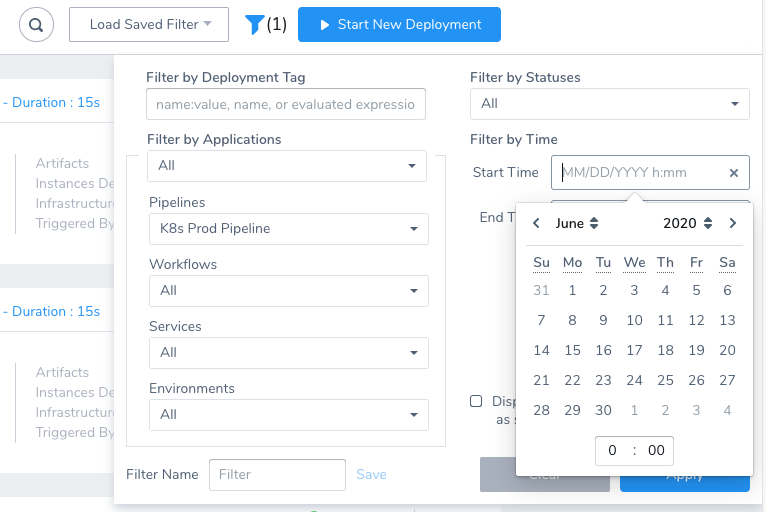
- Use the filter settings to get the exact logs you want to export. Be sure to use the Filter by and Filter by Time settings to control which deployments you download and their date range.
Once you have the deployments you want to export, you can begin the export process.
Export Deployment Logs
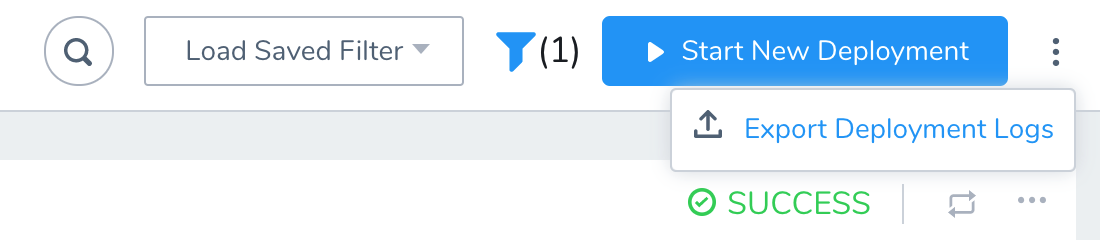
- In the Deployments page, click the options button and click Export Deployment Logs.
- In Export Deployment Logs, specify the Harness User Groups to notify when the log file is ready.
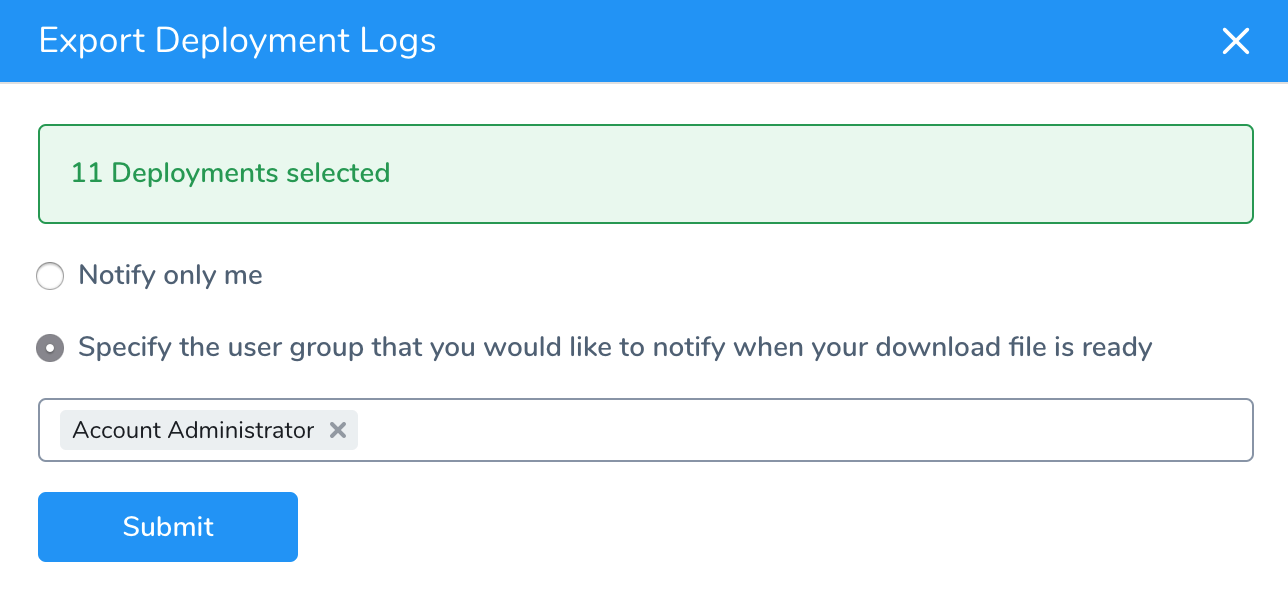 The User Groups are notified using their email and/or Slack settings, as described in Manage User Notifications.
 - Click Submit.
Download Log File
Check the User Group's email or Slack channels (or other notification tools) for the Export Execution Logs message:
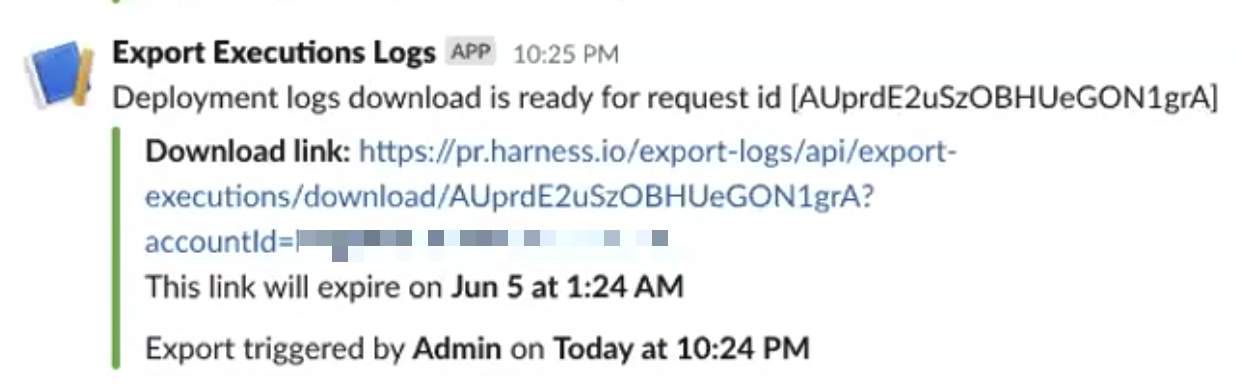
As you can see, the message has a Download link. Click that link to download the log archive.
Option 2: Export Using the Harness API
You can use Harness API mutation exportExecutions to fetch your deployment logs. It provides all of the same options as the Harness Manager.
exportExecutions includes the following arguments:
clientMutationId: String

filters: [ExecutionFilter!]
  Execution filters

notifyOnlyTriggeringUser: Boolean
  Notify only the triggering user

userGroupIds: [String!]
  User group ids
You will use these arguments to specify the deployment logs you want. You can also use Executionfilter fields to control which deployments you download and their date range.
Here's an example that downloads an Application's deployments and uses the startTime field to filter:
mutation {
  exportExecutions(input: {
    clientMutationId: "gqahal-test"
    filters: [
      {application: {operator: IN, values: ["ekftWF9jQRewZt7FhM7KTw"]}},
      {startTime: {operator: AFTER, value: 1590969600000}},
    ]
    userGroupIds: "HhsqnZRlSCyqTxhVNCqzfA"
  }) {
    clientMutationId
    requestId
    status
    totalExecutions
    triggeredAt
    downloadLink
    expiresAt
    errorMessage
  }
}
The clientMutationId option is simply used here to demonstrate the case where multiple clients are making updates.Note the use of userGroupIds to indicate which Harness User Group to notify via its Notification Settings. You can get the ID using the API queries userGroup or userGroupByName or from the Harness Manager URL when looking at the User Group.
Here is the example response:
{
  "data": {
    "exportExecutions": {
      "clientMutationId": "gqahal-test",
      "requestId": "o63US8waSImWhoEnlDAEcg",
      "status": "QUEUED",
      "totalExecutions": 2,
      "triggeredAt": 1591390258752,
      "downloadLink": "https://pr.harness.io/export-logs/api/export-executions/download/o63US8waSImWhoEnlDAEcg?accountId=kmpySmUISimoRrJL6NL73w",
      "expiresAt": 1591660258751,
      "errorMessage": null
    }
  }
}
Here is a screenshot showing them together:
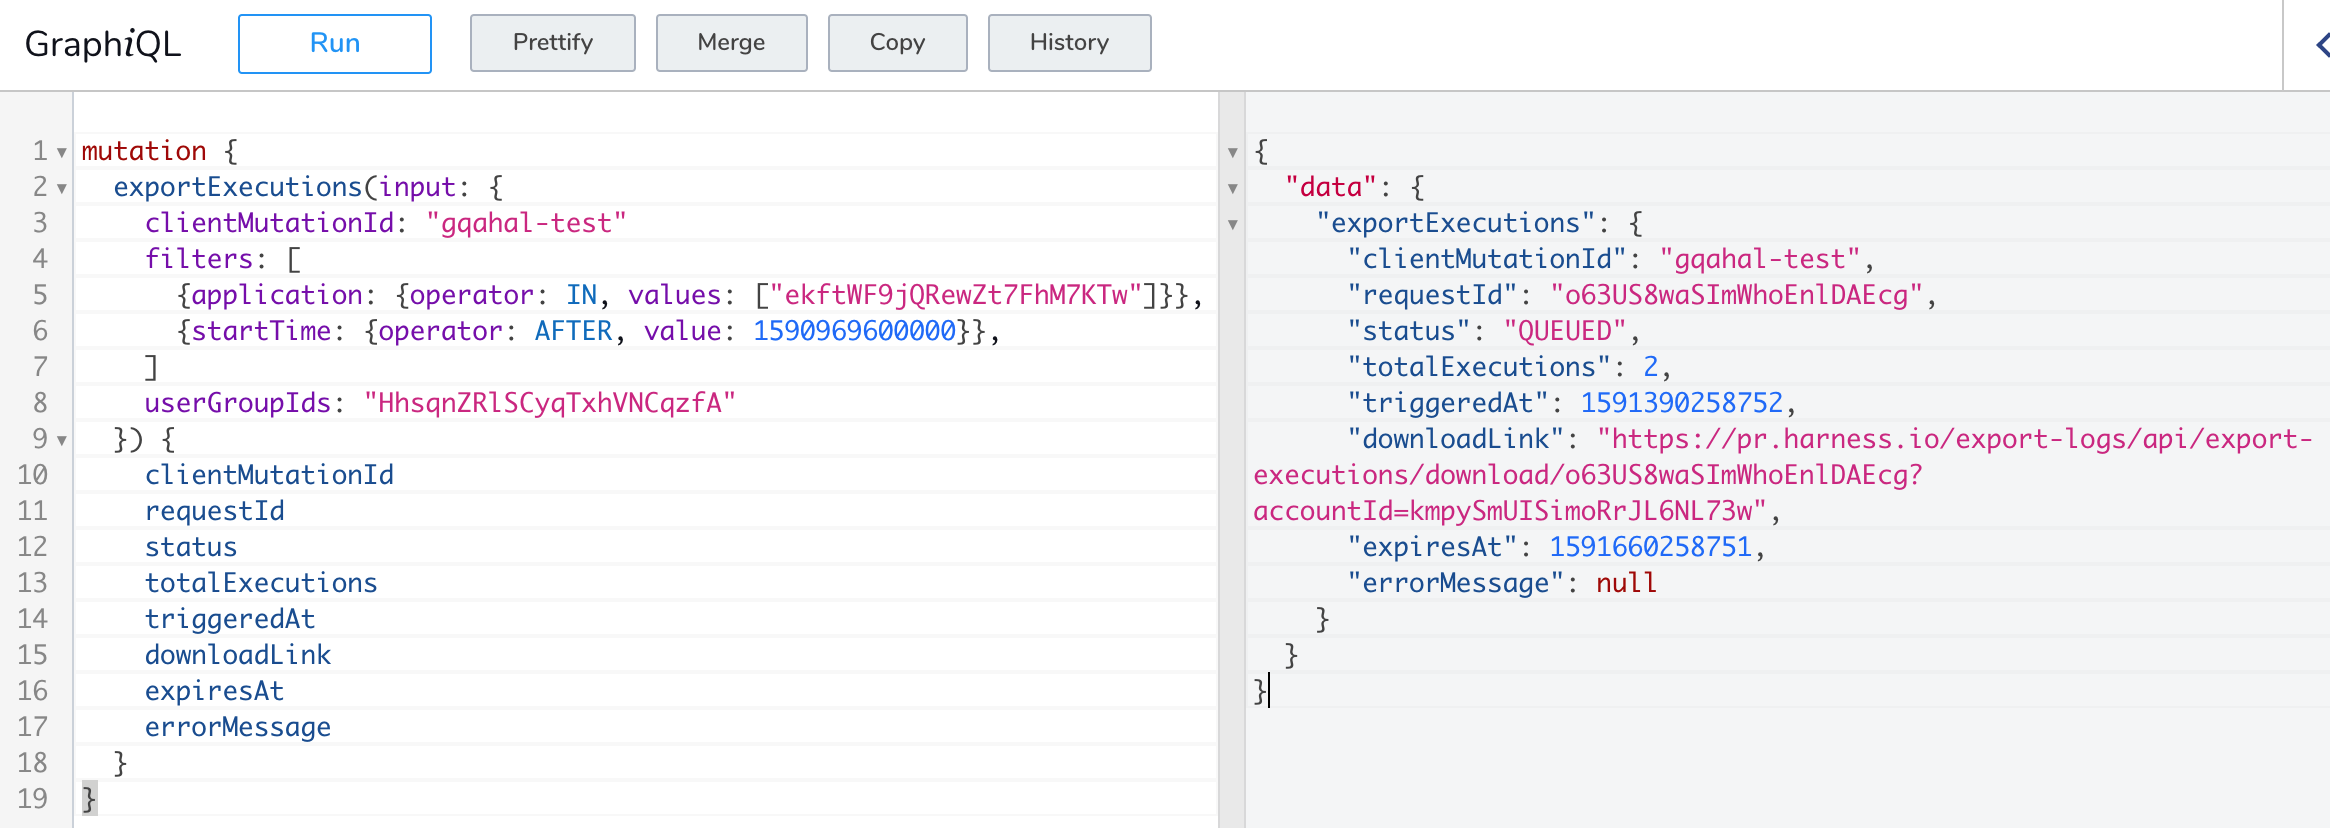
The downloadLink field contains the link to your export log archive.
Look for the status code in the results. It will show "status": "QUEUED" until the export is ready.
There are four statuses:
- EXPIRED
- FAILED
- QUEUED
- READY
When the export is ready, it will show "status": "READY".
When the status code is READY you can download the log archive using the link.
Step 1: Examine the Log Files
Once you have downloaded and extracted the log archive, you will have the folder named HarnessExecutionsLogs.
Inside, you will see separate folders for each deployment:
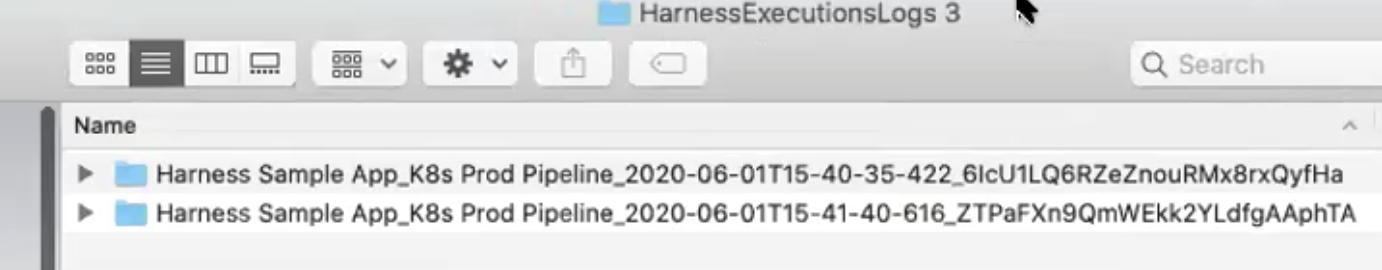
The folder name shows the deployment timestamp and unique ID.
Open a folder and you will see that each deployment step has a different log file.
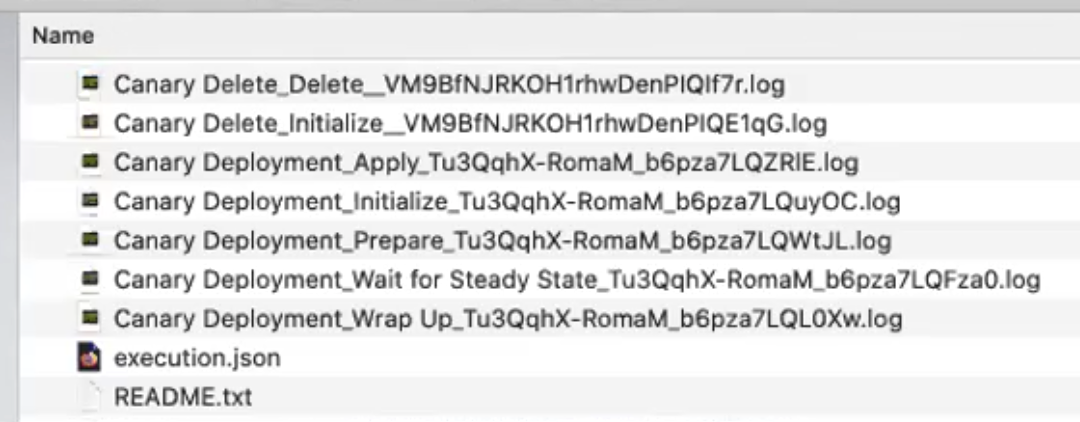
These correspond to the deployment steps and subcommands displayed in the Harness Deployments page.
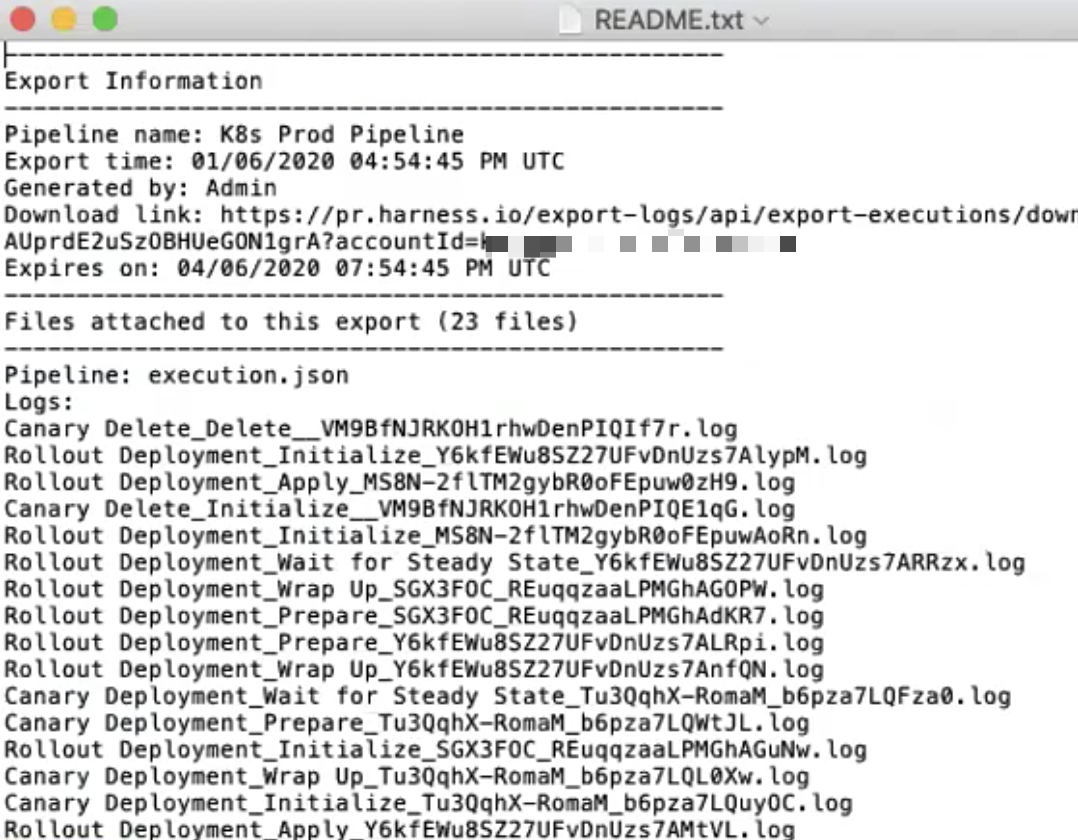
The README file contains a summary of all log files.
Open a log file and you will see the deployment information for the step subcommands.
Step 2: Use the JSON Export File
In each deployment folder there is a file named execution.json.
The execution.json file contains your entire Pipeline or Workflow structure, all Workflow steps and subcommands, Services, artifacts, Harness Delegates, and so on.
The execution log file for each subcommand is listed also:
...
            "subCommands" : [ {
              "name" : "Execute",
              "type" : "COMMAND",
              "status" : "FAILURE",
              "executionLogFile" : "Shell Script_Execute_Oc8AGrsXR6KimnFPTN97AgXlt2.log"
            } ],
...