2 – 24/7 Service Guard for Instana
Harness 24/7 Service Guard monitors your live applications, catching problems that surface minutes or hours following deployment. For more information, see 24/7 Service Guard Overview.
You can add your Instana monitoring to Harness 24/7 Service Guard in your Harness Application Environment. For a setup overview, see Instana Connection Setup.
This section assumes you have a Harness Application set up, containing a Service and an Environment. For steps on setting up a Harness Application, see Application Components.
24/7 Service Guard Setup
To set up 24/7 Service Guard for Instana:
Ensure that you have added Instana as a Harness Verification Provider, as described in Verification Provider Setup.
In your Harness Application, ensure that you have added a Service, as described in Services. For 24/7 Service Guard, you do not need to add an Artifact Source to the Service, nor configure its settings. You simply need to create a Service, and name it. It will represent your application for 24/7 Service Guard.
In your Harness Application, click Environments.
In Environments, ensure that you have added an Environment for the Service you added. For steps on adding an Environment, see Environments.
Click the Environment for your Service. Typically, the Environment Type is Production.
In the Environment page, locate 24/7 Service Guard.
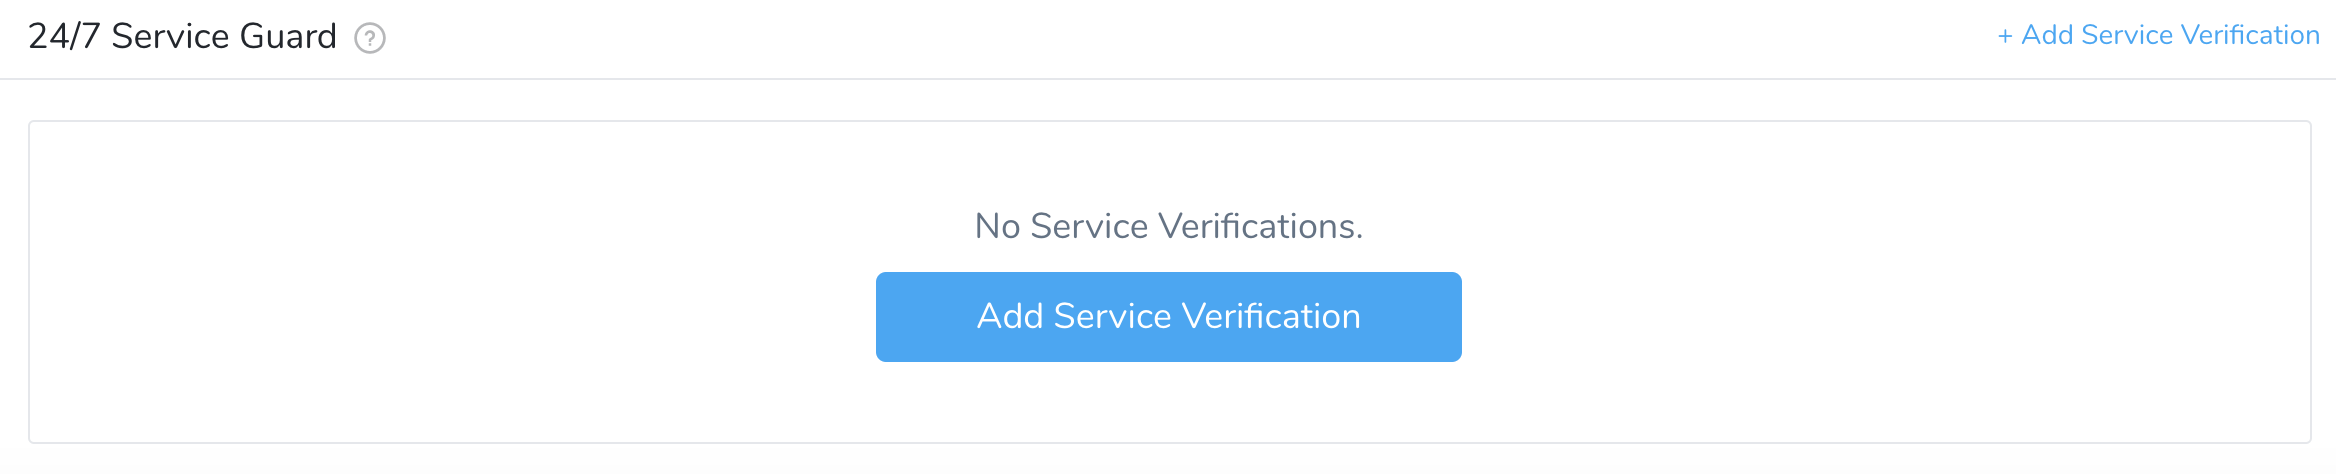
In 24/7 Service Guard, click Add Service Verification, and select click Instana. The Instana dialog appears.
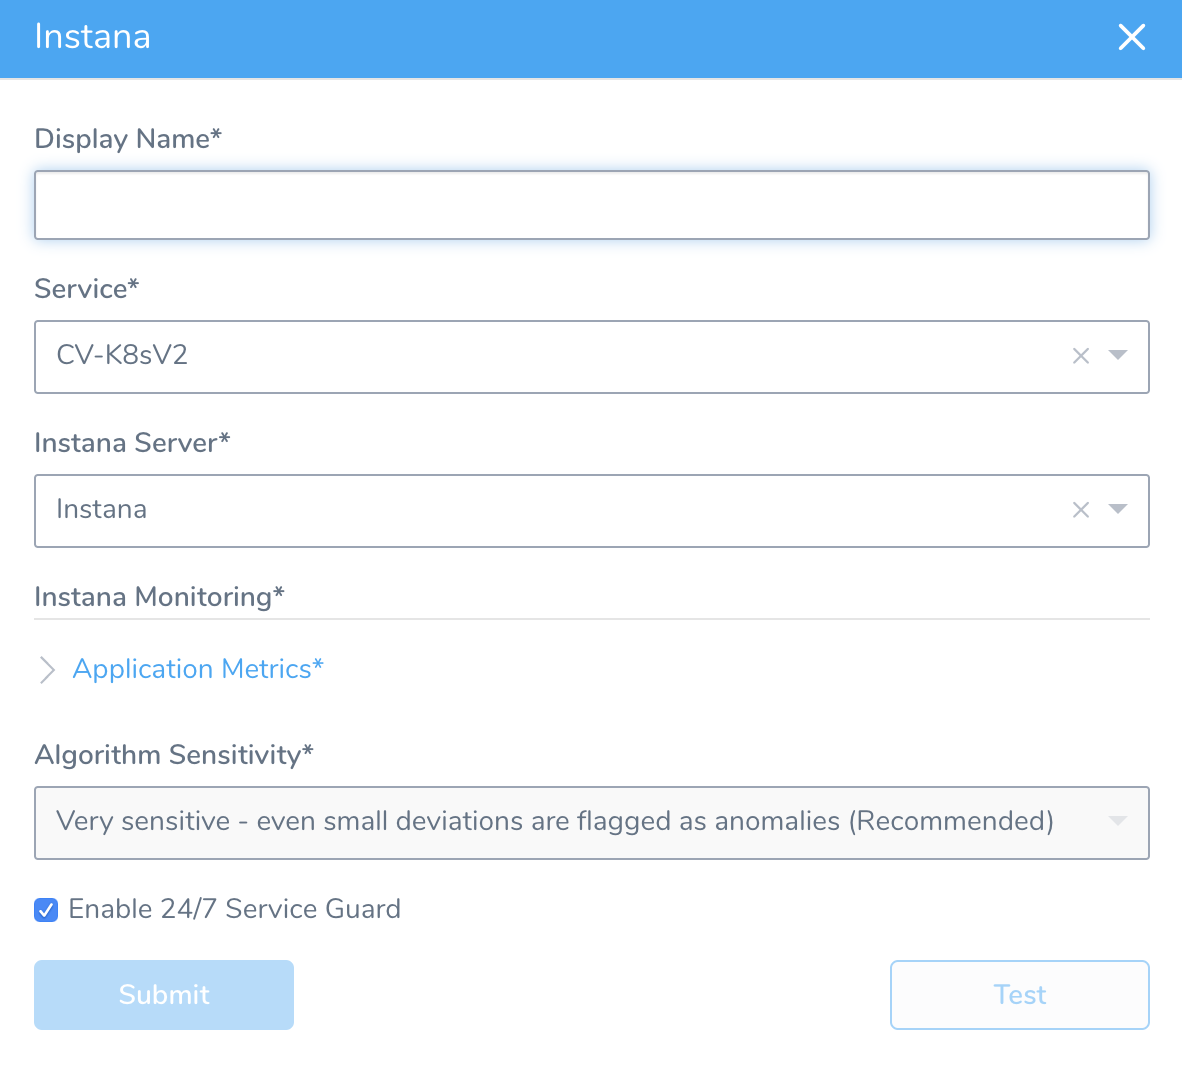
Fill out the dialog. The dialog has the following fields.
For 24/7 Service Guard, the queries you define to collect metrics are specific to the Application or Service you want monitored. Verification is Application/Service level. This is unlike Workflows, where verification is performed at the host/node/pod level.
Display Name -- The name that will identify this Service on the Continuous Verification dashboard. Use a name that indicates the Environment and monitoring tool, such as Instana.
Service -- The Harness Service to monitor with 24/7 Service Guard.
Instana Server -- Select the Instana Verification Provider to use.
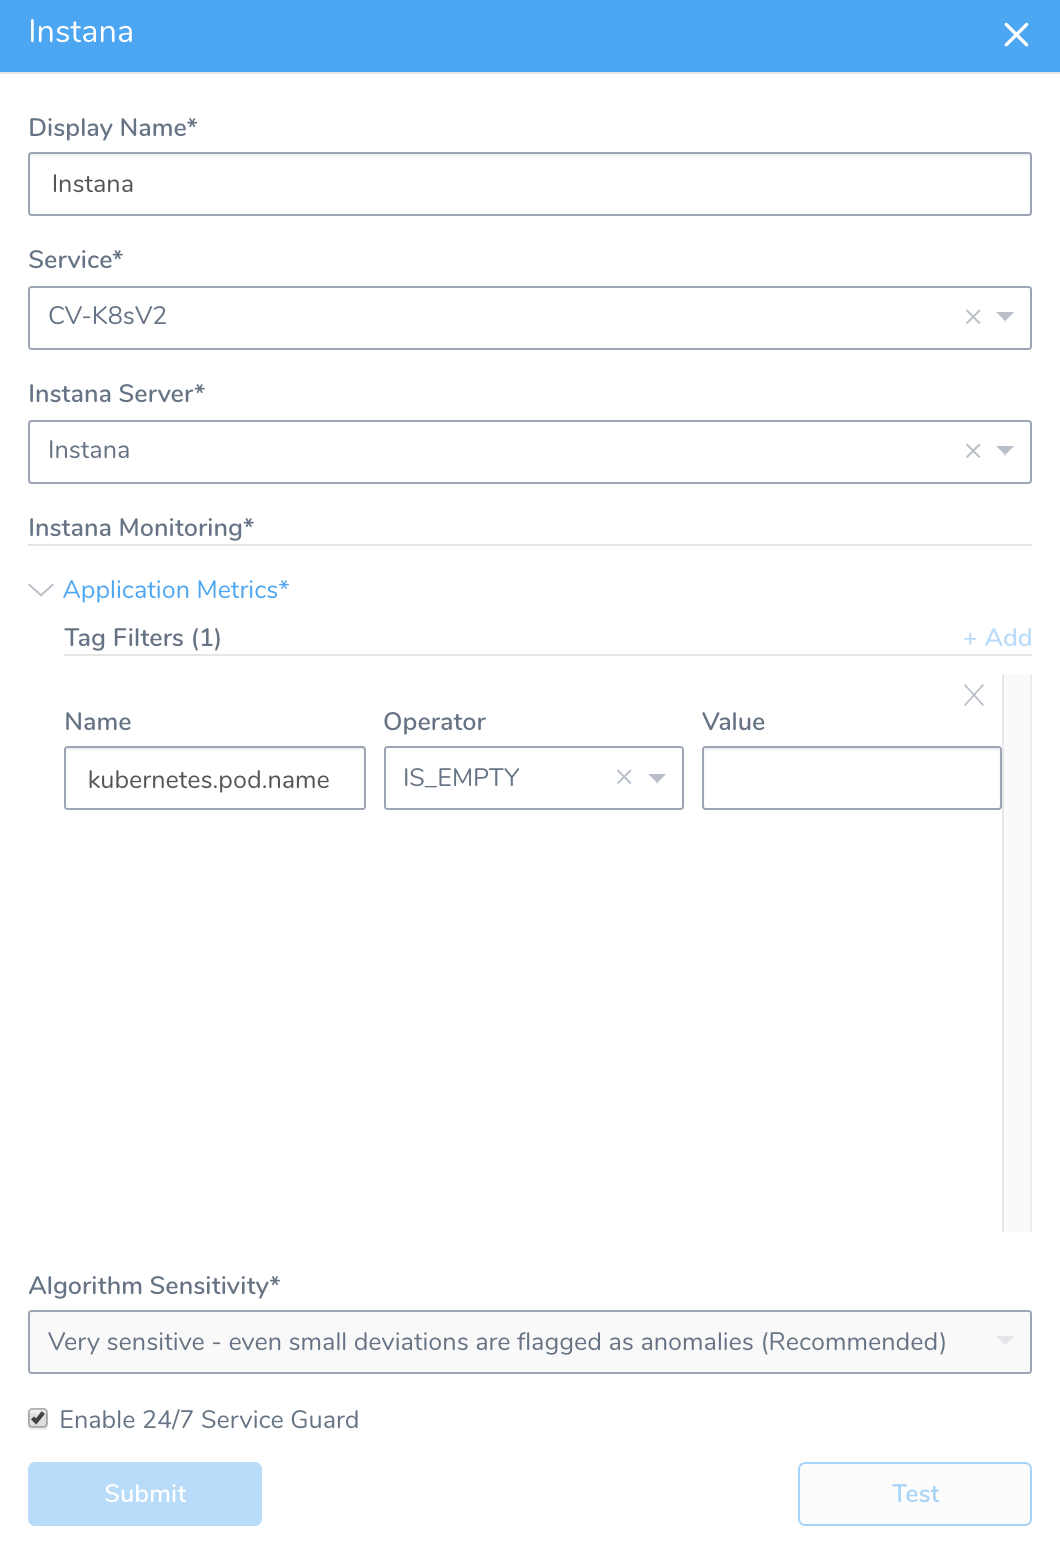
Application Metrics -- This section is where you specify API endpoint metrics to monitor from Instana:
- Click Add to display a Tag Filters row, as shown below.You must specify at least one Tag Filter. These correspond to Filters applied to your metrics on Instana's Analytics tab > Filters.
- In the Name field, enter the Instana Filter's name, such as
kubernetes.pod.name. - Select an Operator to define the threshold or condition for considering this metric anomalous.
- Enter a Value corresponding to the Operator.
- To define additional Tag Filters, repeat the above steps.
Algorithm Sensitivity -- See CV Strategies, Tuning, and Best Practices.Moderately sensitive is recommended.
Enable 24/7 Service Guard -- Select this check box to turn on 24/7 Service Guard monitoring with Instana. If you simply want to set up 24/7 Service Guard, but not yet enable it, leave this check box empty.
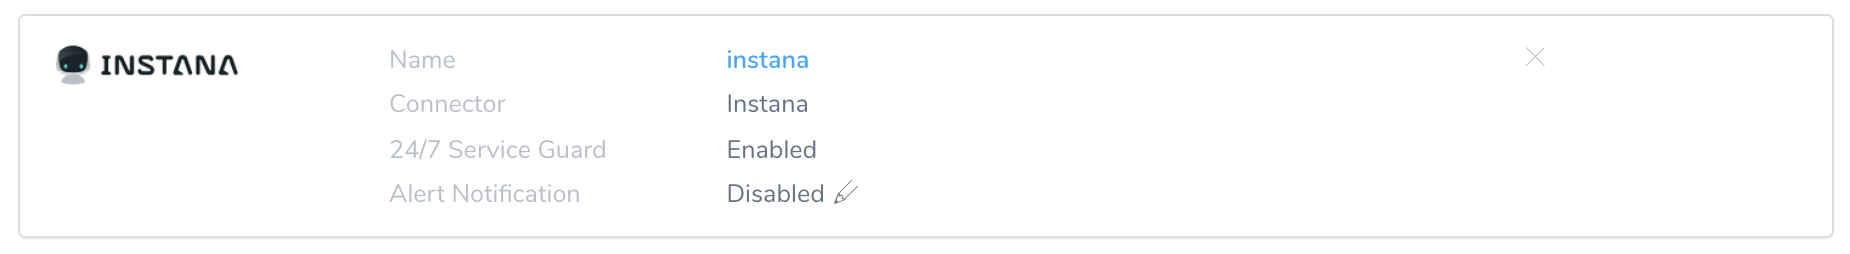
When you are finished, the dialog will look something like this:
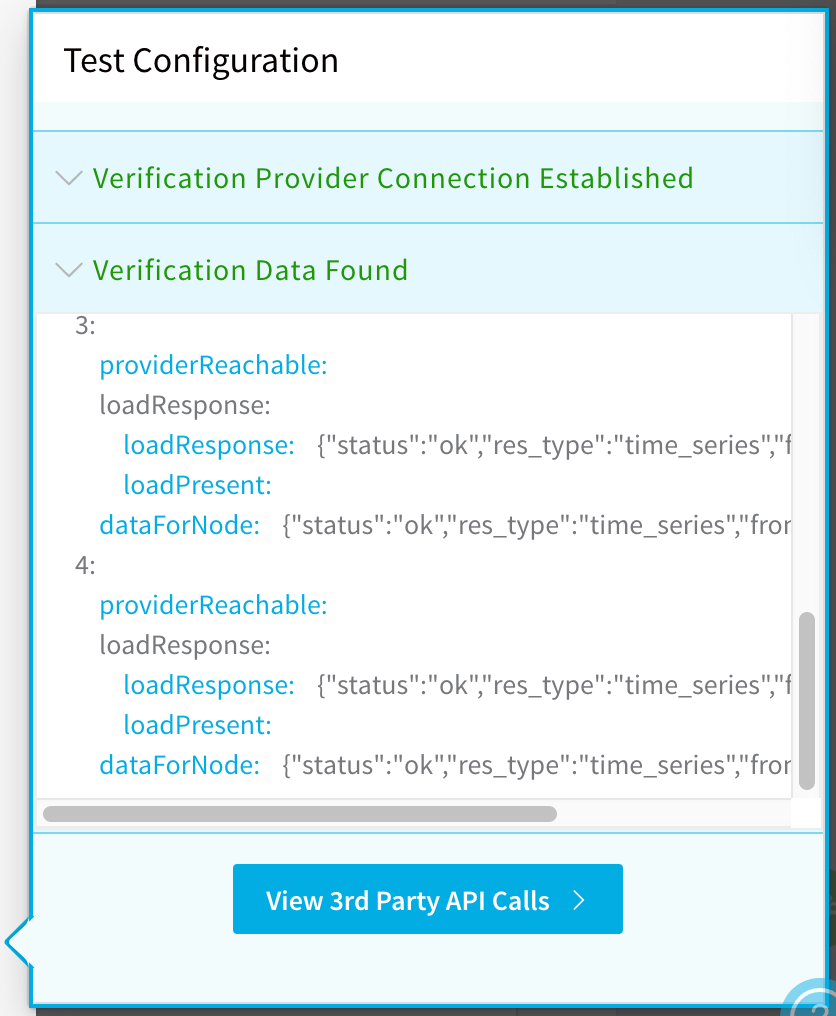
Click Test. Harness verifies the settings that you entered.
Click Submit. Instana 24/7 Service Guard monitoring is now configured.
To see the running 24/7 Service Guard analysis, click Continuous Verification.
The 24/7 Service Guard dashboard displays your production verification results.
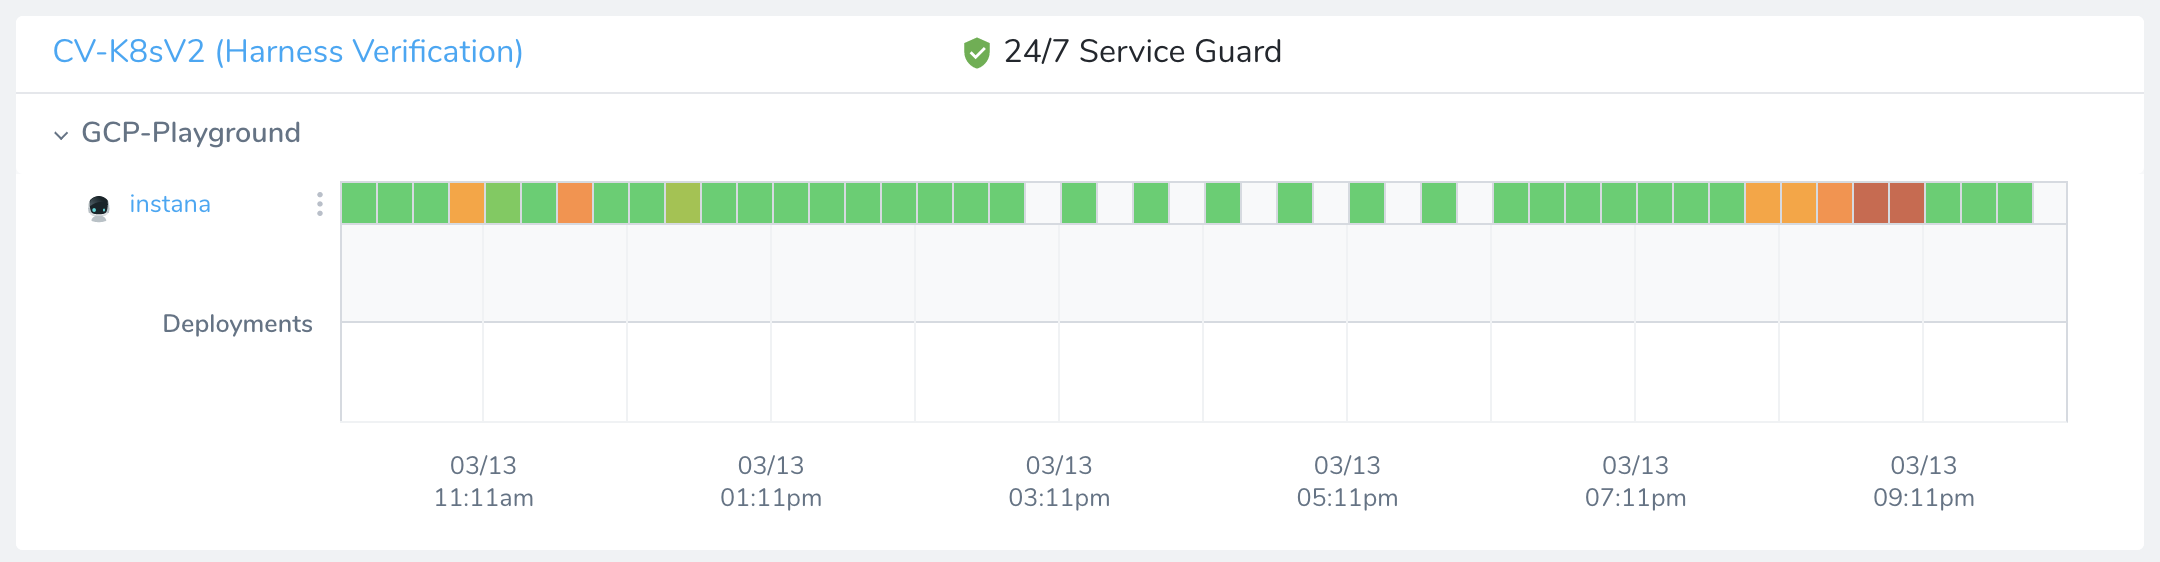
For more information, see 24/7 Service Guard Overview.