Monitor Applications 24/7 with New Relic
Harness 24/7 Service Guard monitors your live applications, catching problems that surface minutes or hours following deployment. For more information, see 24/7 Service Guard Overview.
You can add your New Relic monitoring to Harness 24/7 Service Guard in your Harness Application Environment. For a setup overview, see Connect to New Relic.
This section assumes you have a Harness Application set up and containing a Service and Environment. For steps on setting up a Harness Application, see Application Components.
Before You Begin
- See the New Relic Verification Overview.
- See Connect to New Relic.
Visual Summary
Here's an example of a 24/7 Service Guard configuration for New Relic.

Step 1: Set Up 24/7 Service Guard for New Relic
To set up 24/7 Service Guard for New Relic, do the following:
Ensure that you have added New Relic as a Harness Verification Provider, as described in Verification Provider Setup.
In your Harness Application, ensure that you have added a Service, as described in Services. For 24/7 Service Guard, you do not need to add an Artifact Source to the Service, or configure its settings. You simply need to create a Service and name it. It will represent your application for 24/7 Service Guard.
In your Harness Application, click Environments.
In Environments, ensure that you have added an Environment for the Service you added. For steps on adding an Environment, see Environments.
Click the Environment for your Service. Typically, the Environment Type is Production.
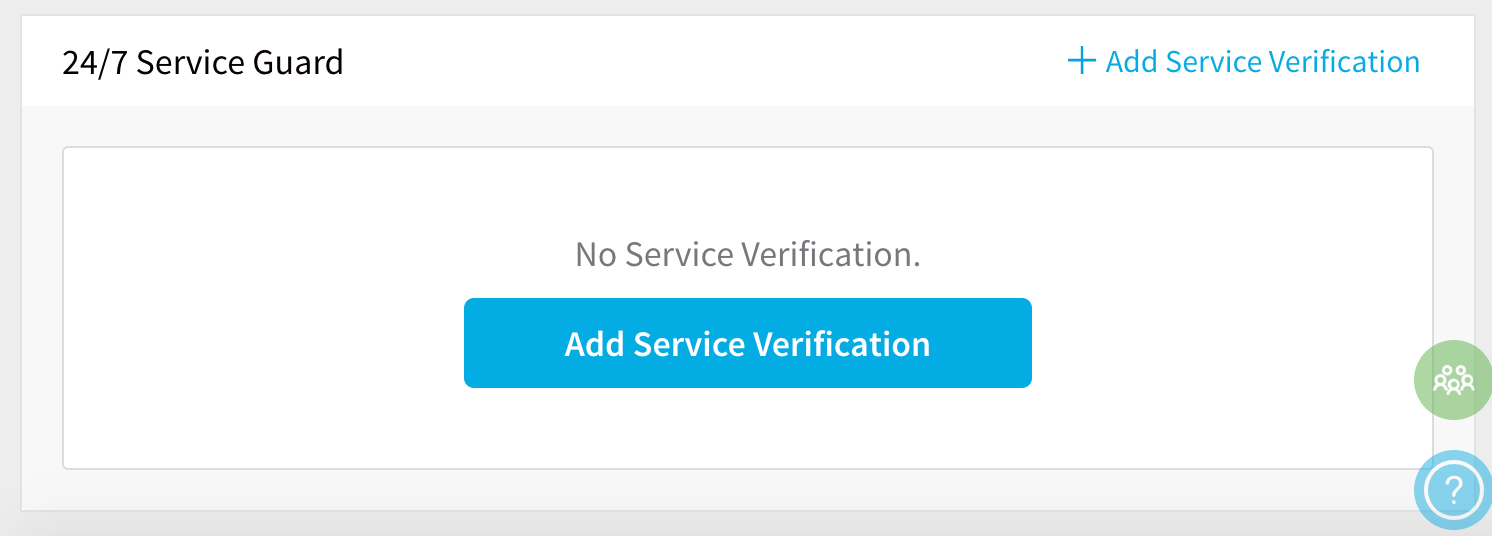
In the Environment page, locate 24/7 Service Guard.

In 24/7 Service Guard, click Add Service Verification, and then click New Relic.

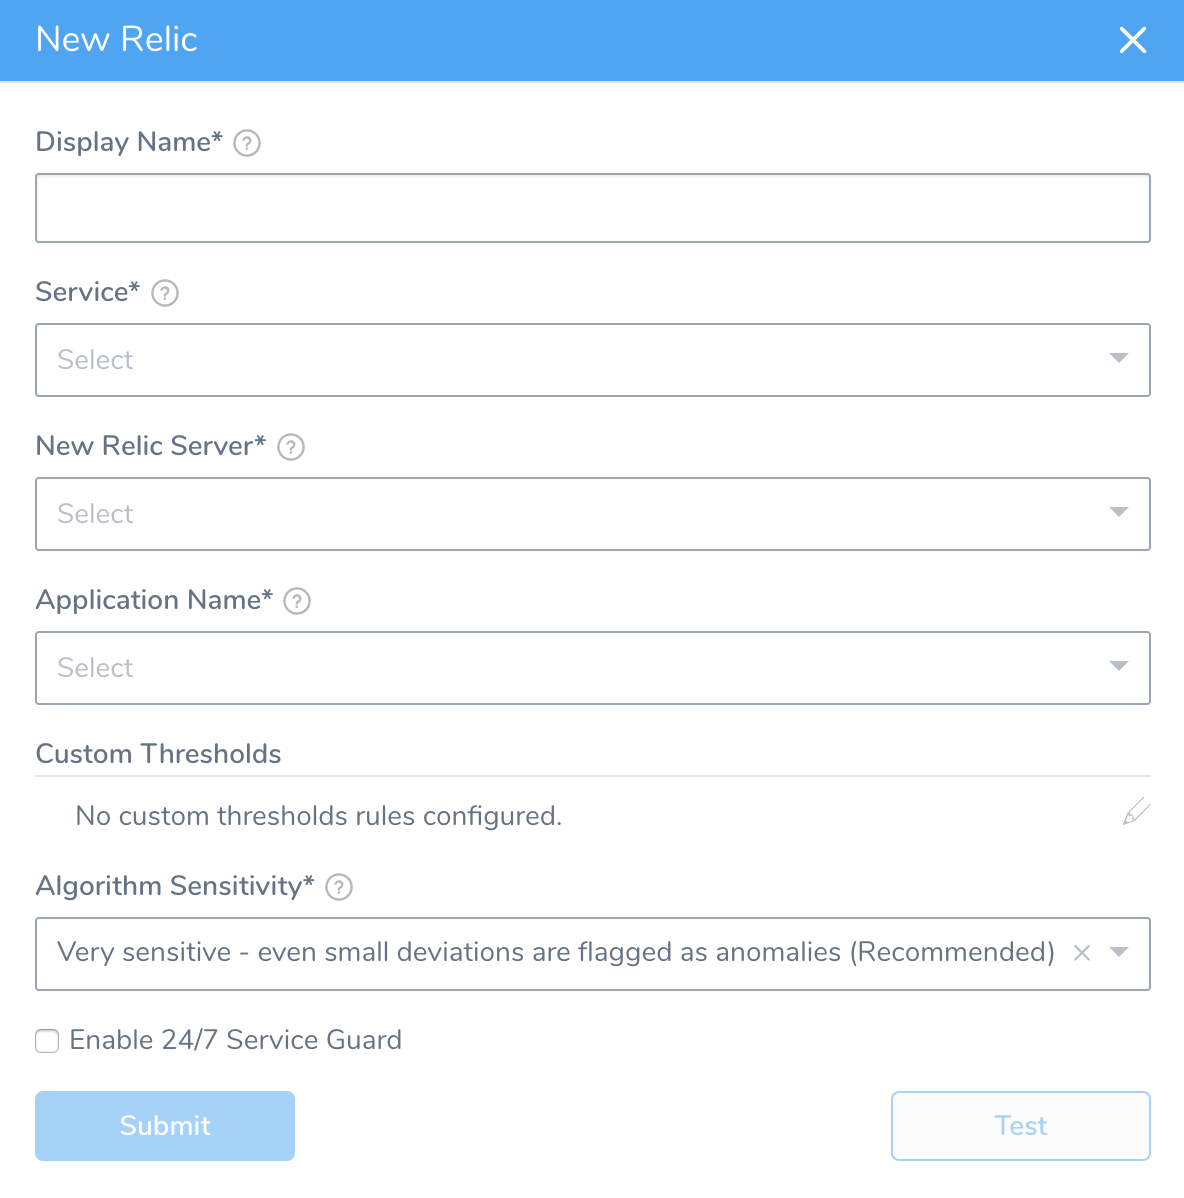
Fill out the dialog. The dialog has the following fields.
For 24/7 Service Guard, the queries you define to collect logs are specific to the application or service you want monitored. Verification is application/service level. This is unlike Workflows, where verification is performed at the host/node/pod level.
Step 2: Display Name
The name that will identify this service on the Continuous Verification dashboard. Use a name that indicates the environment and monitoring tool, such as New Relic.
Step 3: Service
The Harness Service to monitor with 24/7 Service Guard.
Step 4: New Relic Server
Select the New Relic Verification Provider to use.
Step 5: Application Name
Select the Application Name used by the monitoring tool. If your New Relic account contains hundreds or thousands of applications, Harness requests that you enter in the application name. You can just paste in the application name as it appears in the New Relic Applications page Name column.
This is the application name used to aggregate data in the New Relic UI. You set both the license and the app name as part of the New Relic installation process.
To find your application, in New Relic, click Applications. The list of applications is displayed on the Applications page.
Step 6: Custom Thresholds
In the Custom Thresholds section, you can define Ignore Hints. These are rules that instruct Harness to skip certain metrics/value combinations from verification analysis.
To configure these rules, see Apply Custom Thresholds to 24/7 Service Guard.
Step 7: Algorithm Sensitivity
Specify the sensitivity to determine what events are identified as anomalies.
See CV Strategies, Tuning, and Best Practices.
Step 8: Enable 24/7 Service Guard
Enable this setting to turn on 24/7 Service Guard. If you simply want to set up 24/7 Service Guard, but not enable it, leave this setting disabled.
Step 9: Verify Settings
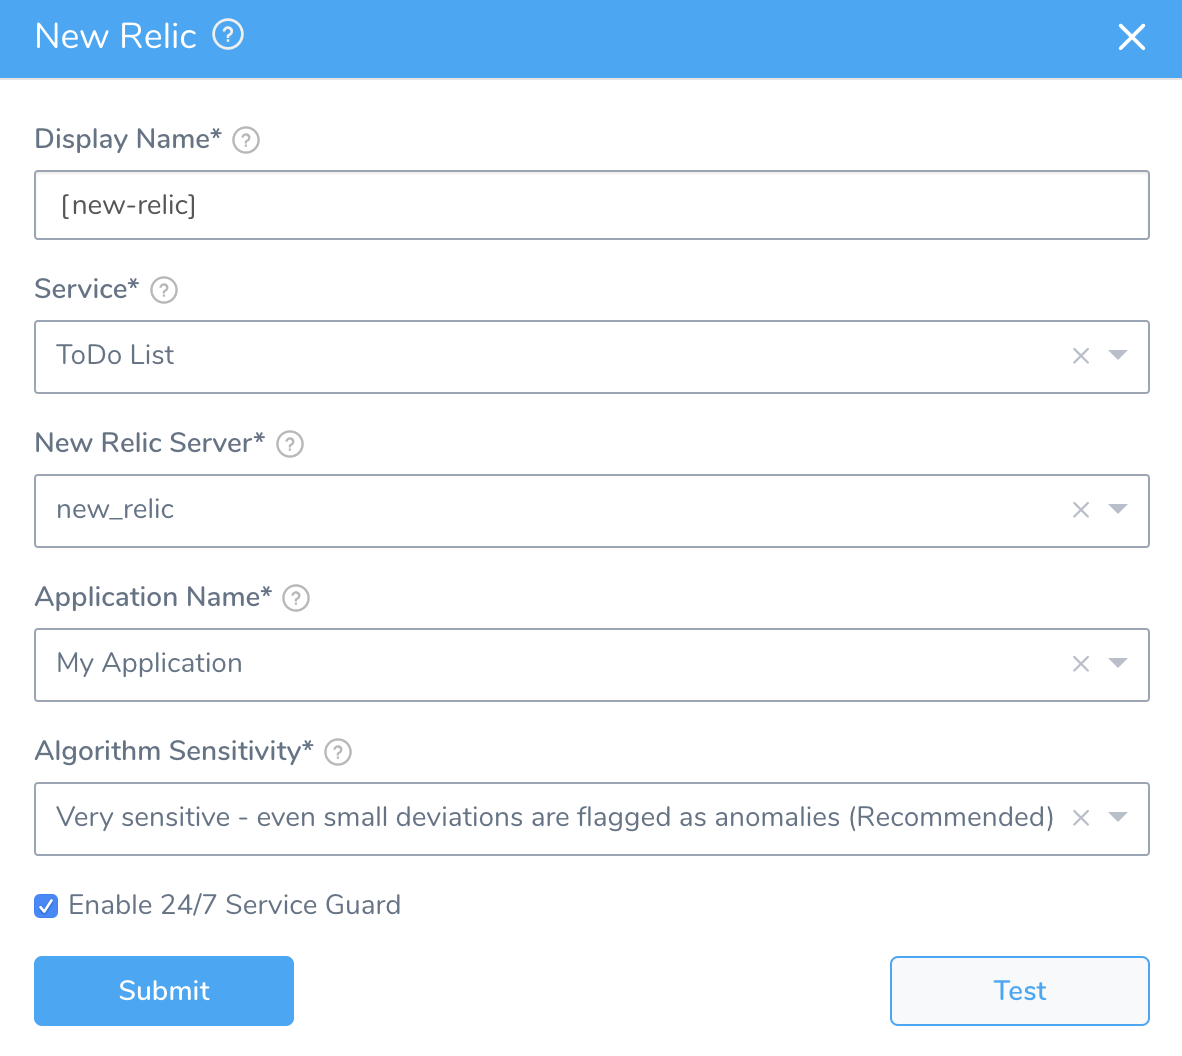
When you are finished, the dialog will look something like this:

Click Test. Harness verifies the settings you entered.
Click Submit. New Relic is configured now configured for 24/7 Service Guard monitoring.

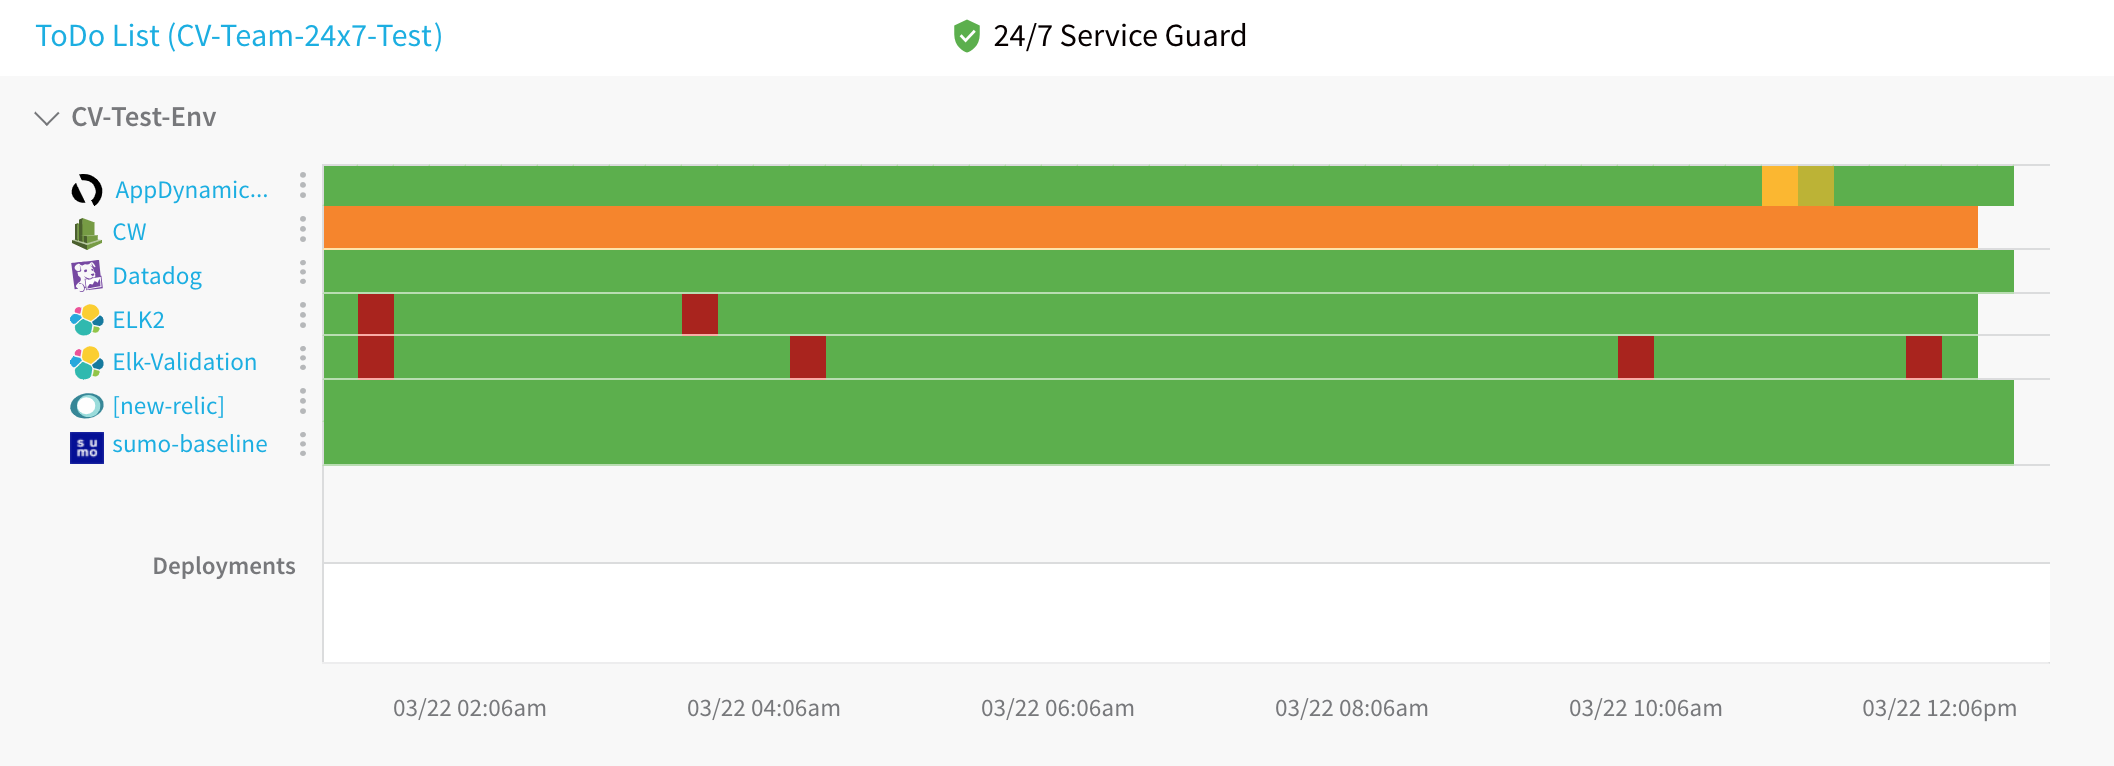
To see the running 24/7 Service Guard analysis, click Continuous Verification.
The 24/7 Service Guard dashboard displays the production verification results.
For information on using the dashboard, see 24/7 Service Guard Overview.

