Monitor Applications 24/7 with Stackdriver Logging
Harness 24/7 Service Guard monitors your live applications, catching problems that surface minutes or hours following deployment.
Once you have set up a Stackdriver Verification Provider in Harness, as described in Connect to Stackdriver, you can add your Stackdriver Logs monitoring to Harness 24/7 Service Guard in your Harness Application Environment.
Before You Begin
- Set up a Harness Application, containing a Service and Environment. See Create an Application.
- See the Stackdriver Verification Overview.
Visual Summary
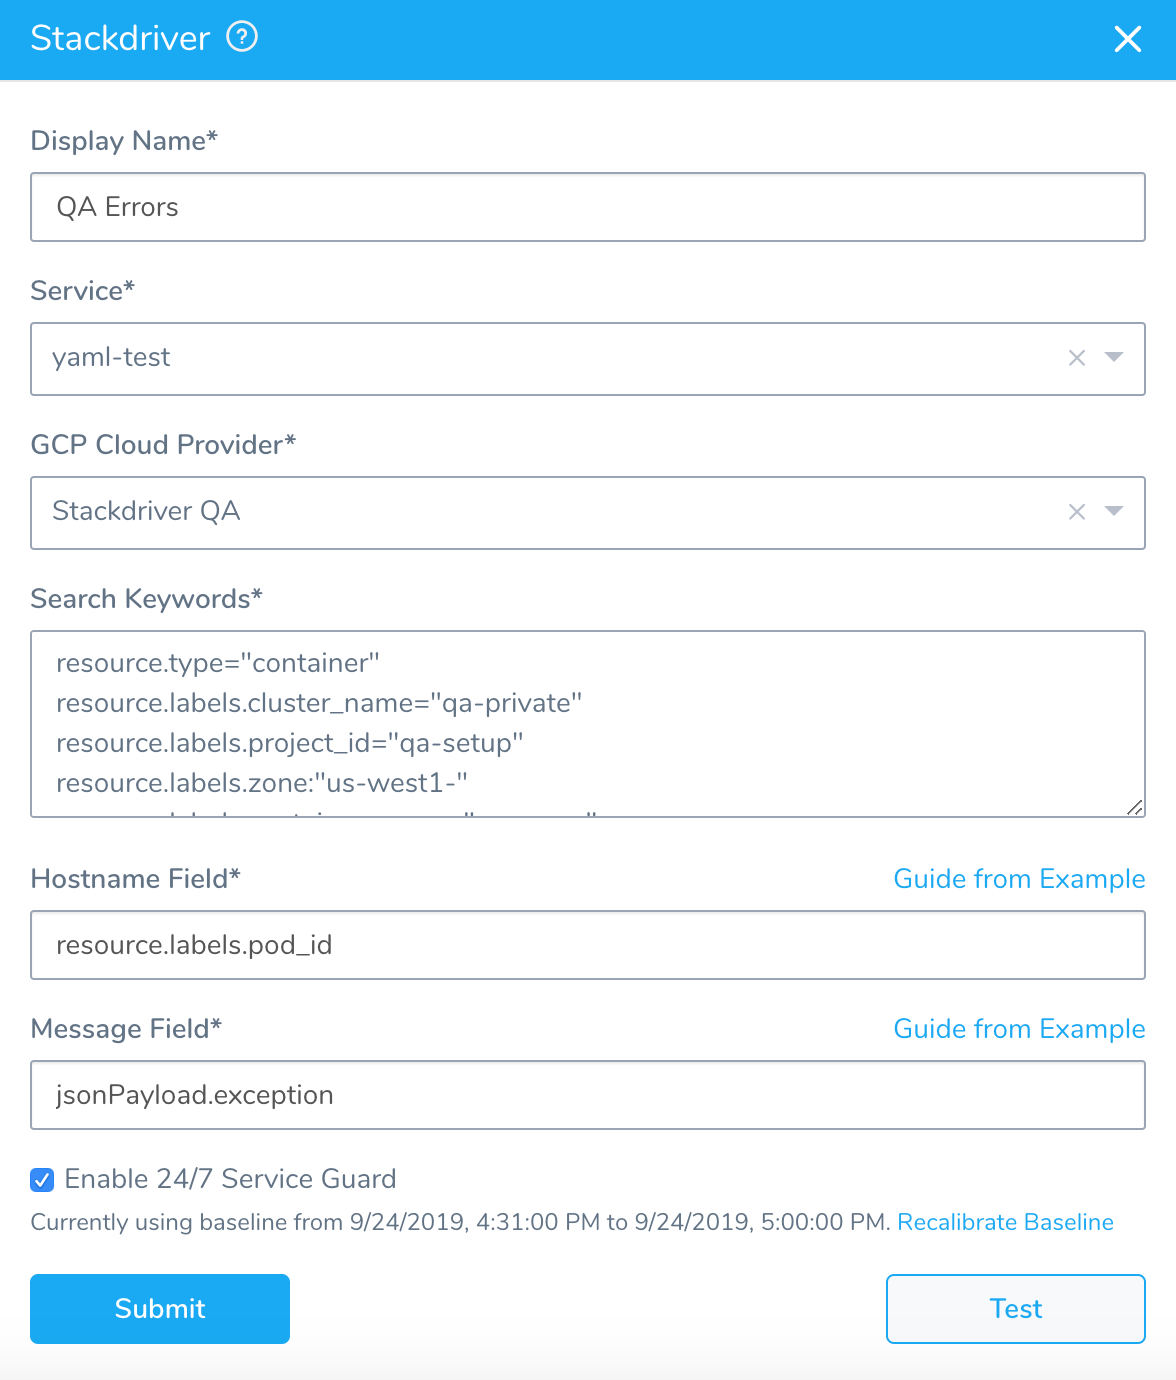
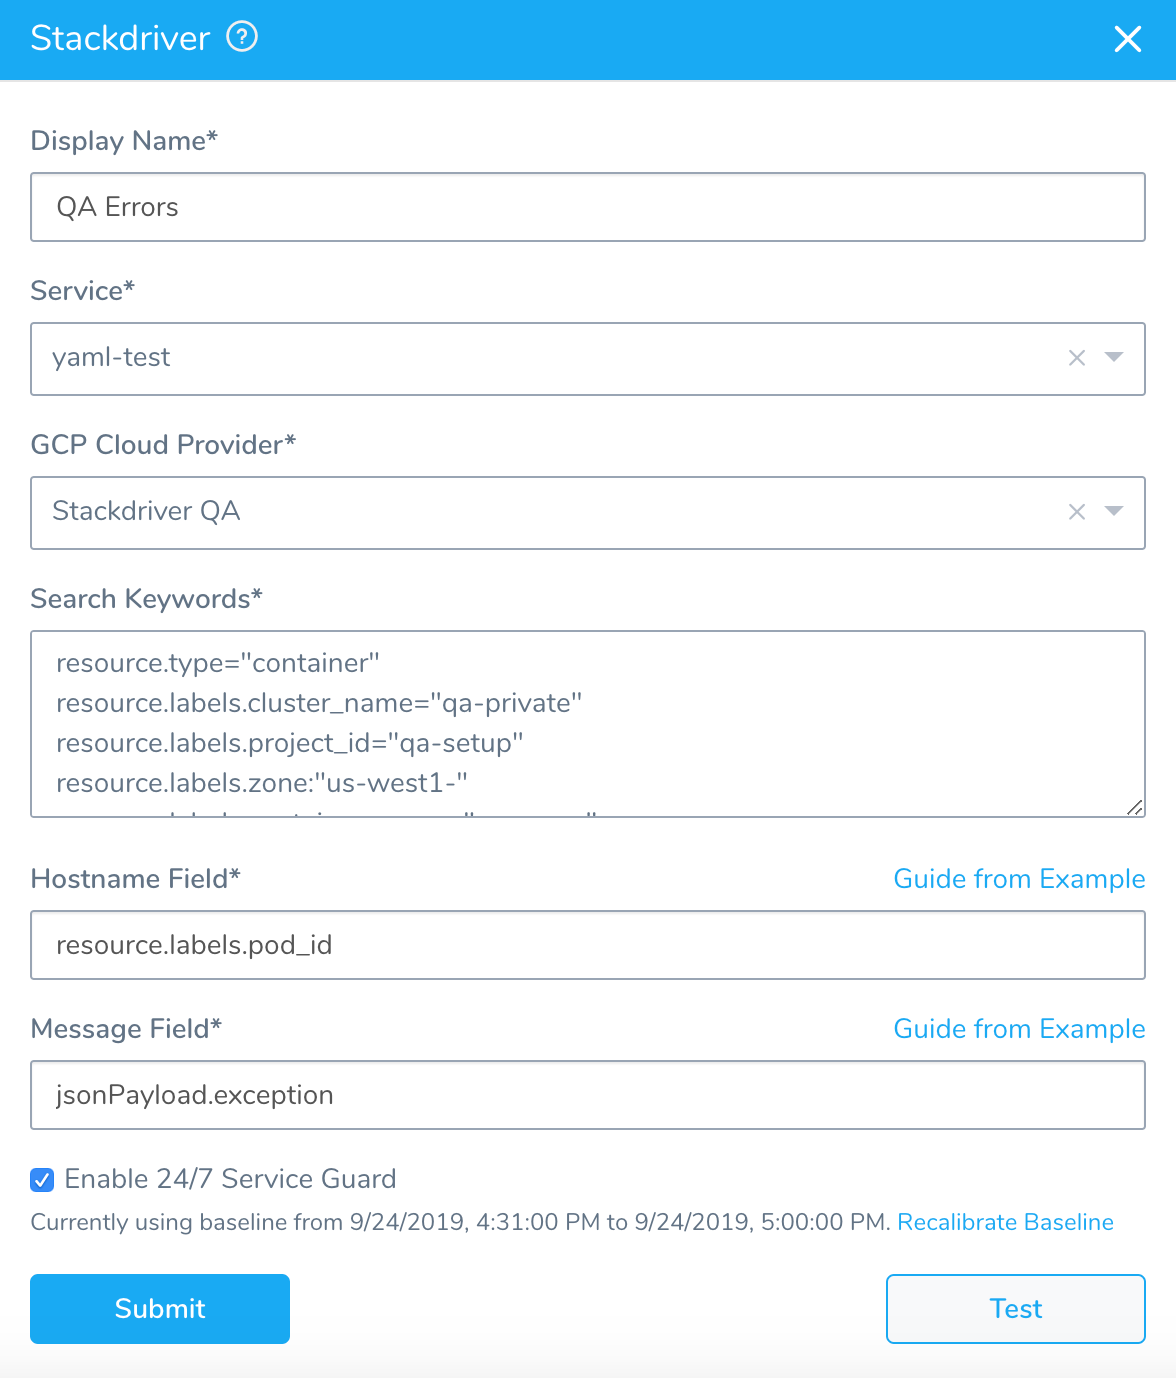
Here's an example of a completed Stackdriver Logging setup for verification.
Step 1: Set up 24/7 Service Guard
To set up 24/7 Service Guard for Stackdriver, do the following:
- Ensure that you have added Stackdriver as a Harness Verification Provider, as described in Connect to Stackdriver.
- In your Harness Application, ensure that you have added a Service, as described in Services. For 24/7 Service Guard, you do not need to add an Artifact Source to the Service, or configure its settings. You simply need to create a Service and name it. It will represent your application for 24/7 Service Guard.
- In your Harness Application, click Environments.
- In Environments, ensure that you have added an Environment for the Service you added. For steps on adding an Environment, see Environments.
- Click the Environment for your Service. Typically, the Environment Type is Production.
- In the Environment page, locate 24/7 Service Guard.
- In 24/7 Service Guard, click Add Service Verification, and then click Stackdriver Log. The Stackdriver Log dialog appears.
Step 2: Display Name
The name that will identify this service on the Continuous Verification dashboard. Use a name that indicates the environment and monitoring tool, such as Stackdriver.
Step 3: Service
The Harness Service to monitor with 24/7 Service Guard.
Step 4: GCP Cloud Provider
Select the GCP Cloud Provider to use, as described in Connect to Stackdriver. If you currently connect to GCP via a Kubernetes Cluster Cloud Provider, you must set up a GCP Cloud Provider for access to the Stackdriver data on your cluster.
Step 5: Search Keywords
Enter search keywords for your query. You can use the same filters you have in GCP Logs Viewer.
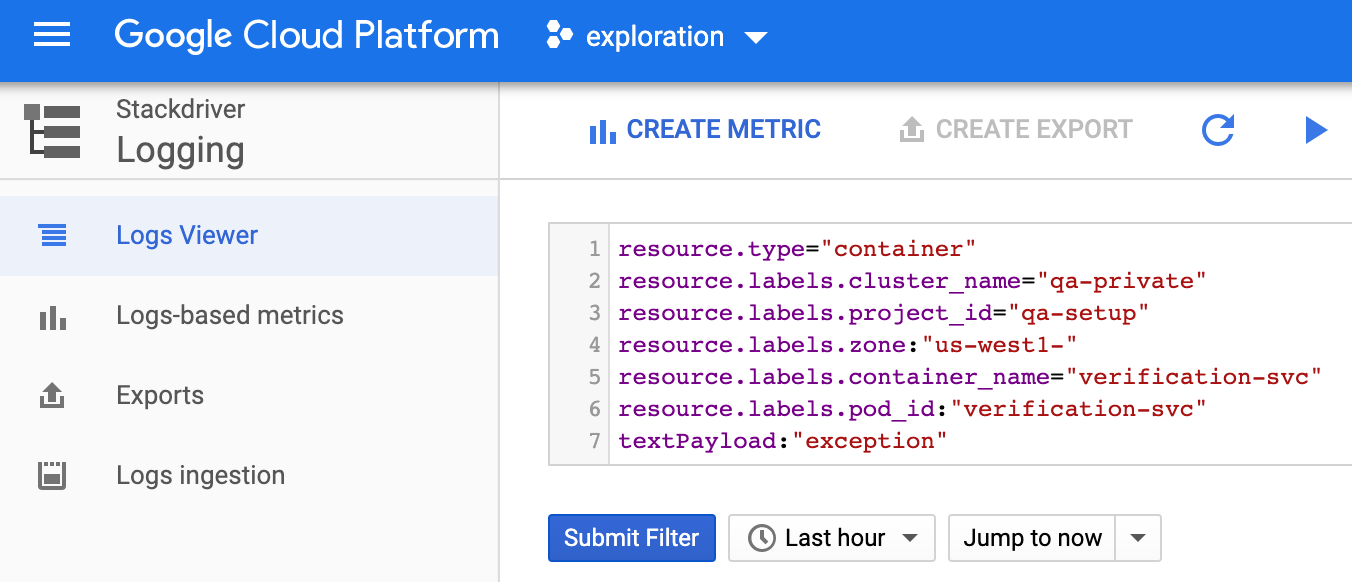
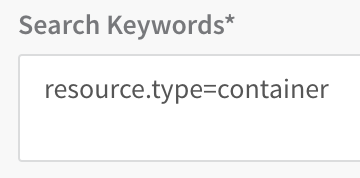
Simply copy a filter entry into Search Keywords:
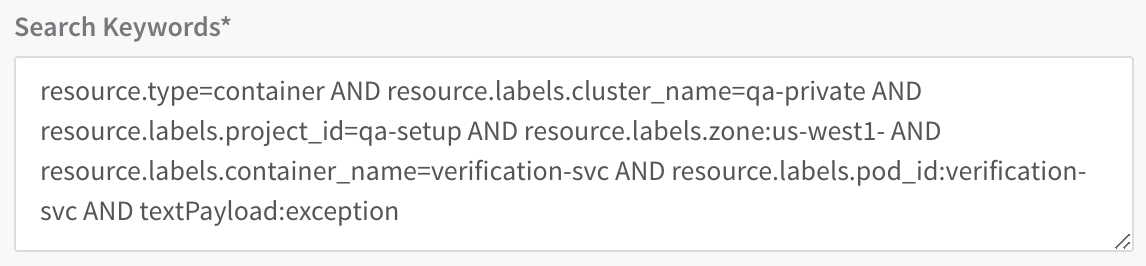
To use multiple filter entries, place an AND between them or use multiline entries. For example:
For advanced filter examples, see Advanced filters library from GCP.
For information on the log entries used, see Viewing Logs from GCP.
Step 6: Host Name Field
Enter the log field that contains the name of the host/pod/container for which you want logs. You can enter a pod ID or field name for example.
Harness uses this field to group data and perform analysis at the container-level.
For example, the query in Search Keywords looks for pods labelled nginx-deployment:
resource.type="container"
resource.labels.pod_id:"nginx-deployment-"
In Host Name Field, you would enter pod_id because it is the log field containing the pod name. In a log, this field will be in the resource section:
...
 resource: {
  labels: {
   cluster_name:  "doc-example"
   container_name:  "harness-delegate-instance"
   instance_id:  "1733097732247470454"
   namespace_id:  "harness-delegate"
 **pod\_id: "harness-sample-k8s-delegate-wverks-0"**   project_id:  "exploration-161417"
   zone:  "us-central1-a"
  }
  type:  "container"
 }
...
Step 7: Enable 24/7 Service Guard
Click the checkbox to enable 24/7 Service Guard.
Step 8: Baseline
Select the baseline time unit for monitoring. For example, if you select For 4 hours, Harness will collect the logs for the last 4 hours as the baseline for comparisons with future logs. If you select Custom Range you can enter a Start Time and End Time.
When you are finished, the dialog will look something like this:
Step 9: Verify Your Settings
- Click TEST. Harness verifies the settings you entered.
- Click SUBMIT. The Stackdriver 24/7 Service Guard is configured.
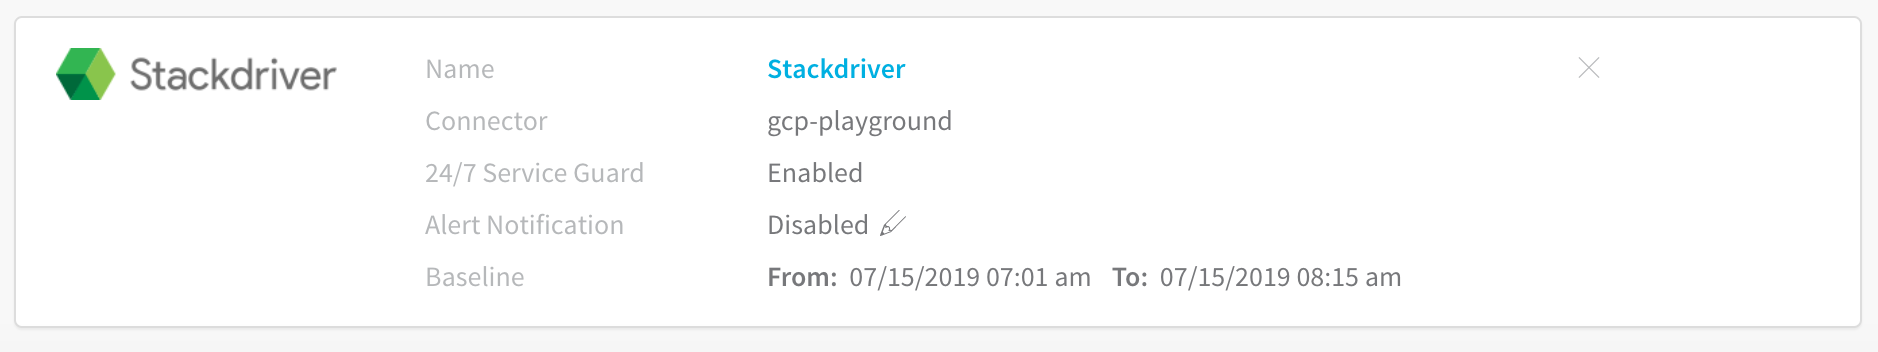
To see the running 24/7 Service Guard analysis, click Continuous Verification. The 24/7 Service Guard dashboard displays the production verification results.
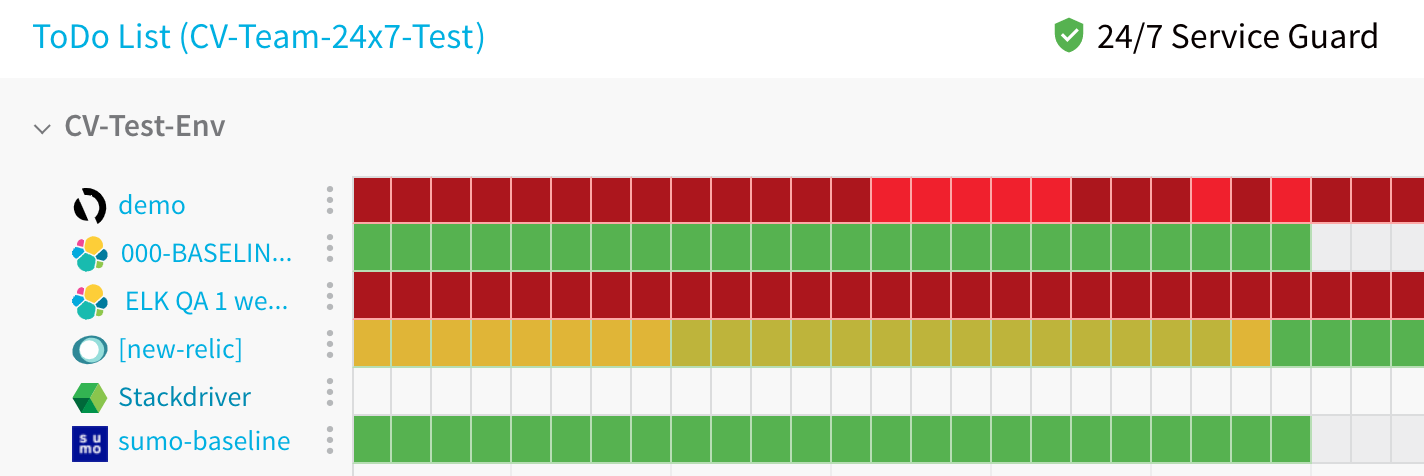
For more information, see 24/7 Service Guard Overview.