Verify Deployments with Stackdriver Logging
Harness can analyze Stackdriver data and analysis to verify, rollback, and improve deployments. To apply this analysis to your deployments, you set up Stackdriver as a verification step in a Harness Workflow.
This topic covers how to set up Stackdriver Logs in a Harness Workflow, and provides a summary of Harness verification results.
In order to obtain the names of the host(s), pod(s), or container(s) where your service is deployed, the verification provider should be added to your workflow after you have run at least one successful deployment.
Before You Begin
- Set up a Harness Application, containing a Service and Environment. See Create an Application.
- See the Stackdriver Verification Overview.
Visual Summary
Here's an example of a completed Stackdriver setup for verification.
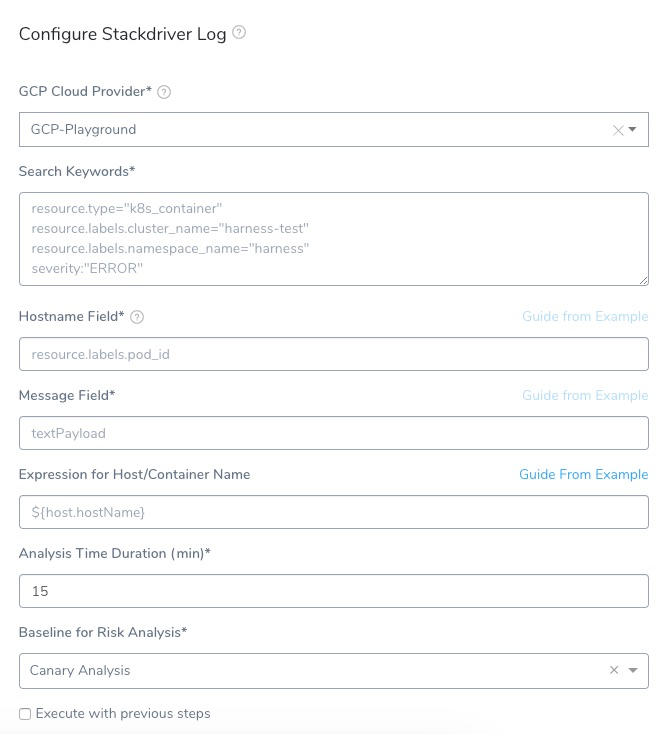
Step 1: Set up the Deployment Verification
To verify your deployment with Stackdriver, do the following:
Ensure that you have added Google Cloud Platform as a Cloud Provider provider, as described in Connect to Stackdriver.
In your Workflow, under Verify Service, click Add Step.
In the resulting Add Step settings, select Log Analysis > Stackdriver.
Click Next. The Configure**Stackdriver** settings appear.
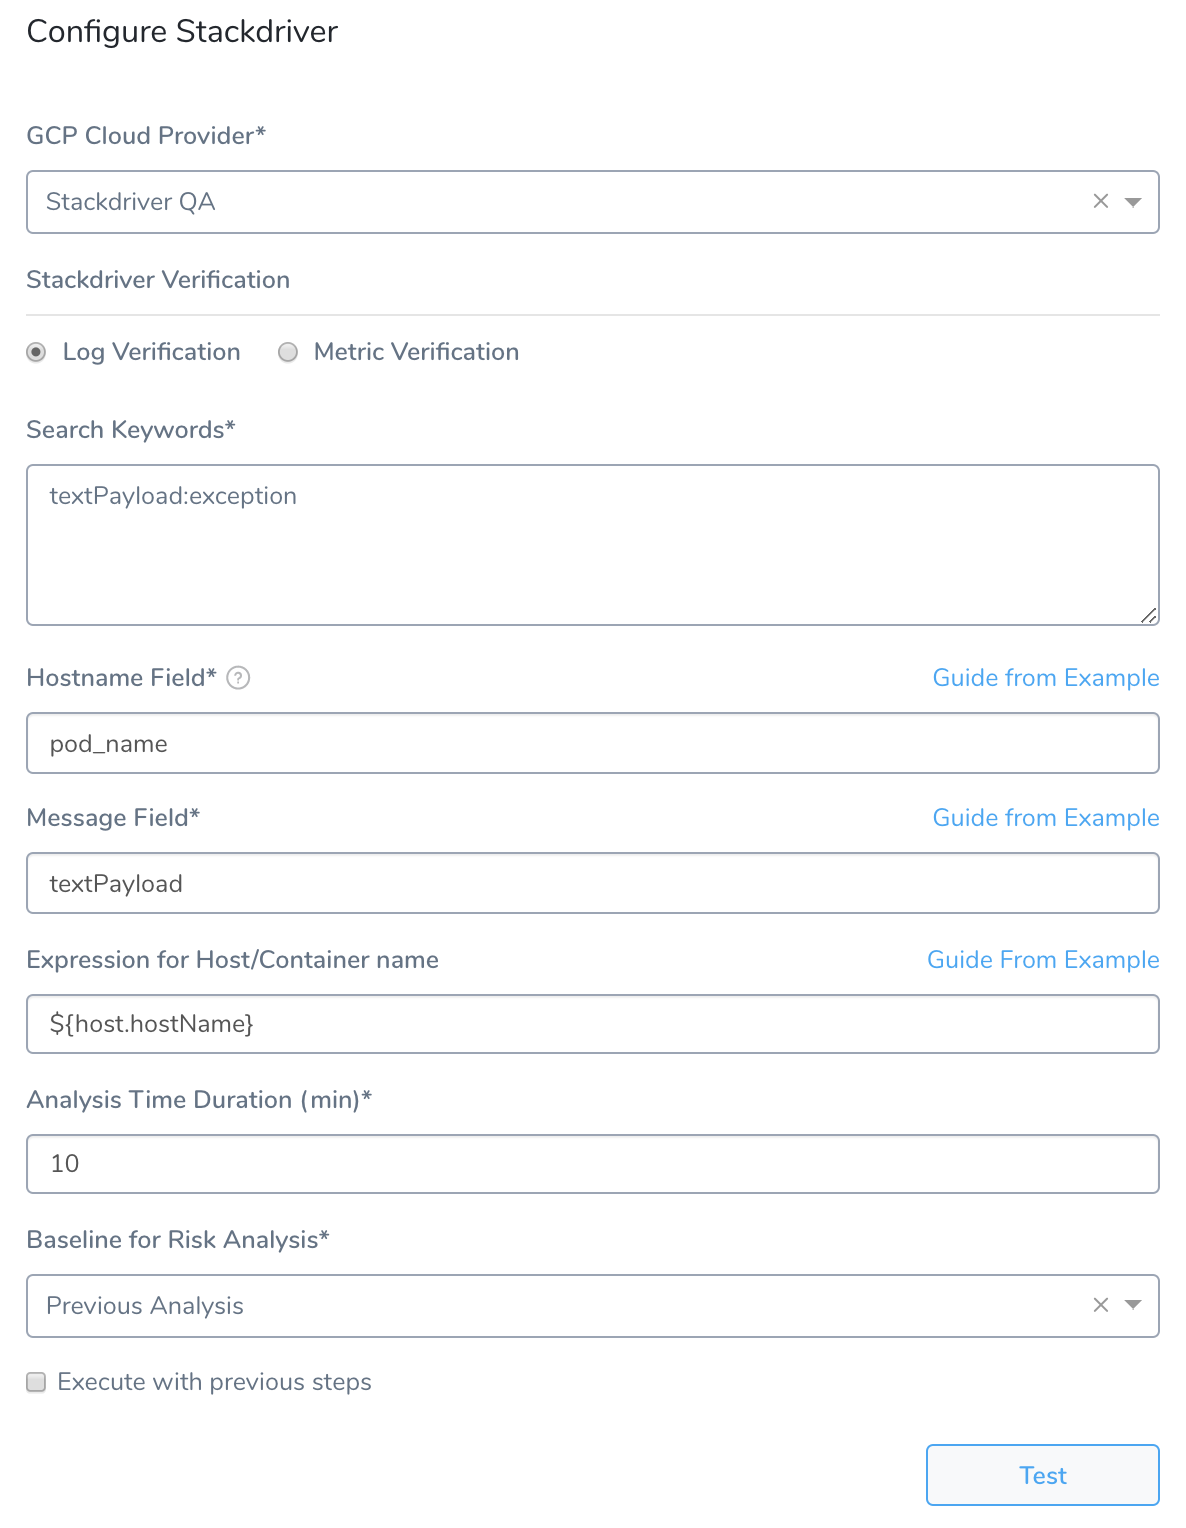
In GCP Cloud Provider, select the Google Cloud Platform (GCP) Cloud Provider you set up in Harness.
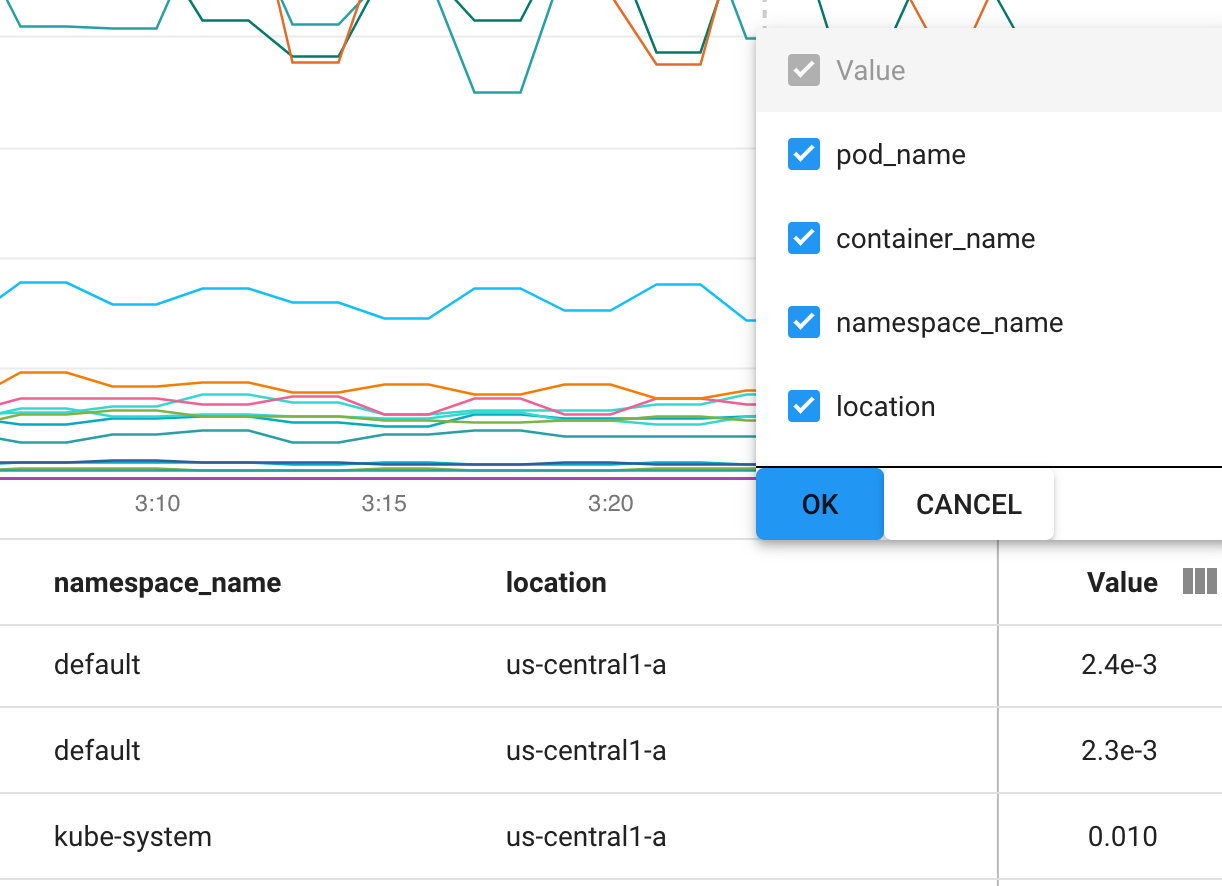
You can also enter variable expressions, such as:${serviceVariable.stackdriver_connector_name}.If the GCP Cloud Provider field contains an expression, the Region field must also use an expression.1. In Region, select the GCP region where the application is hosted. The Stackdriver API uses a service-specific notion of location. Harness uses the name of a region. You can find the region in Stackdriver Metrics Explorer by selecting the location column:
You can also enter a variable expression for the region, such as
${env.name}.Because Harness does not currently support multi-region load balancers, you must add a Stackdriver step for each region. If the GCP Cloud Provider field contains an expression, the Region field must also use an expression.Select Log Verification.
Step 2: Search Keywords
Enter search keywords for your query. You can use the same filters you have in GCP Logs Viewer.
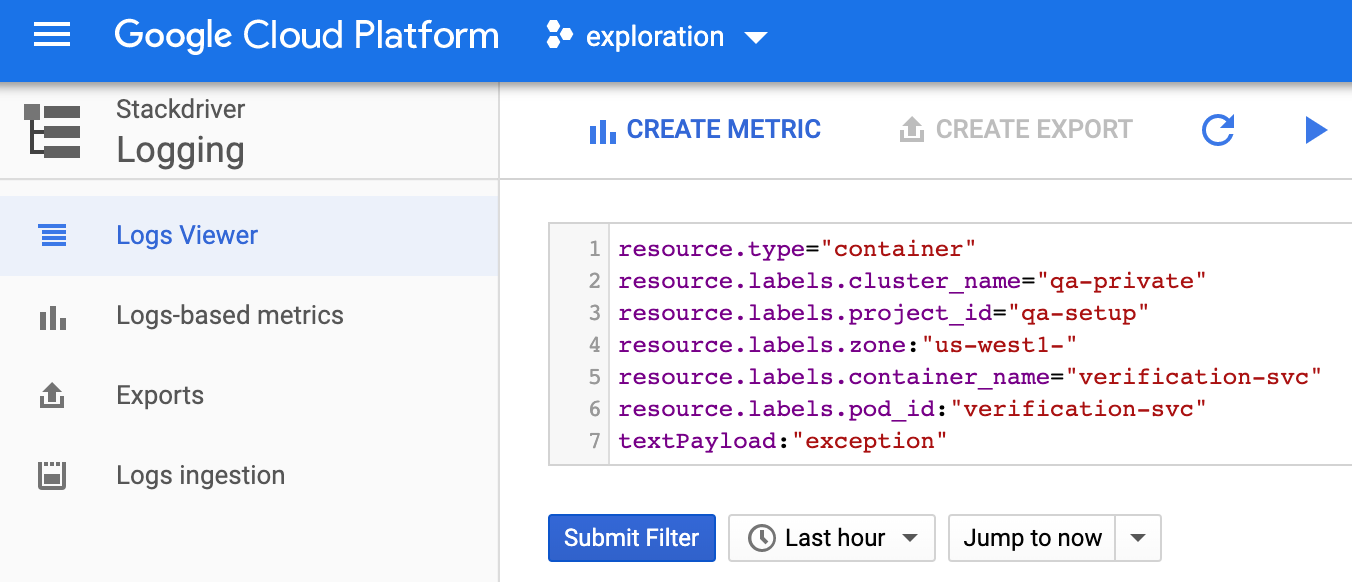
Simply copy a filer entry into Search Keywords:
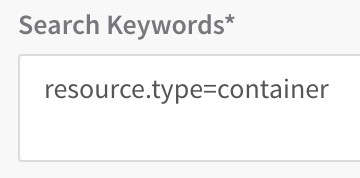
To use multiple filter entries, you can place an AND between them or use multiline entries. For example:

For advanced filter examples, see Advanced filters library from GCP.
Troubleshooting queries
Once you try to verify the deployment and you can encounter an error as follows:
Execution logs are not available for old executions.
Solution
Update your query to include the required statement (jsonPayload.message:* in this case), as follows:
resource.type="k8s_container" resource.labels.cluster_name="guse4-kube-poc" resource.labels.namespace_name="rc"
resource.labels.container_name="hello-container"
jsonPayload.message:*
severity="ERROR"
Step 3: Host Name Field
Enter the log field that contains the name of the host for which you want logs. You can enter a pod ID or name.
For example, the query in Search Keywords looks for pods labelled nginx-deployment:
resource.type="container"
resource.labels.pod_id:"nginx-deployment-"
In Host Name Field, you would enter pod_id because it is the log field containing the pod name. In a log, this field will be in the resource section:
...
 resource: {
  labels: {
   cluster_name:  "doc-example"
   container_name:  "harness-delegate-instance"
   instance_id:  "1733097732247470454"
   namespace_id:  "harness-delegate"
 **pod\_id: "harness-sample-k8s-delegate-wverks-0"**   project_id:  "exploration-161417"
   zone:  "us-central1-a"
  }
  type:  "container"
 }
...
Step 4: Message Field
Enter the field by which the messages are usually indexed. You can also enter variable expressions, such as: ${serviceVariable.message_field}.
Troubleshooting Message Field Entries
If you select jsonPayload.message as Message Field, but the queries return log messages that do not have the field jsonPayload.message, the workflow will fail.
Solution
Add a statement in your query to ensure that the query only fetches logs which always have jsonPayload.message field included, as follows.
jsonPayload.message:*
Step 5: Algorithm Sensitivity
Select the Algorithm Sensitivity. See CV Strategies, Tuning, and Best Practices.
Step 6: Baseline
Select the baseline time unit for monitoring. For example, if you select For 4 hours, Harness will collect the logs for the last 4 hours as the baseline for comparisons with future logs. If you select Custom Range you can enter a Start Time and End Time.
When you are finished, the dialog will look something like this:
Step 7: Confirm Your Settings
Click Test to confirm your settings. In the testing assistant, select a host and click Run. When you have confirmed your settings, click Submit.
The Stackdriver verification step is added to your Workflow.
Review: Harness Expression Support in CV Settings
You can use expressions (${...}) for Harness built-in variables and custom Service and Workflow variables in the settings of Harness Verification Providers.
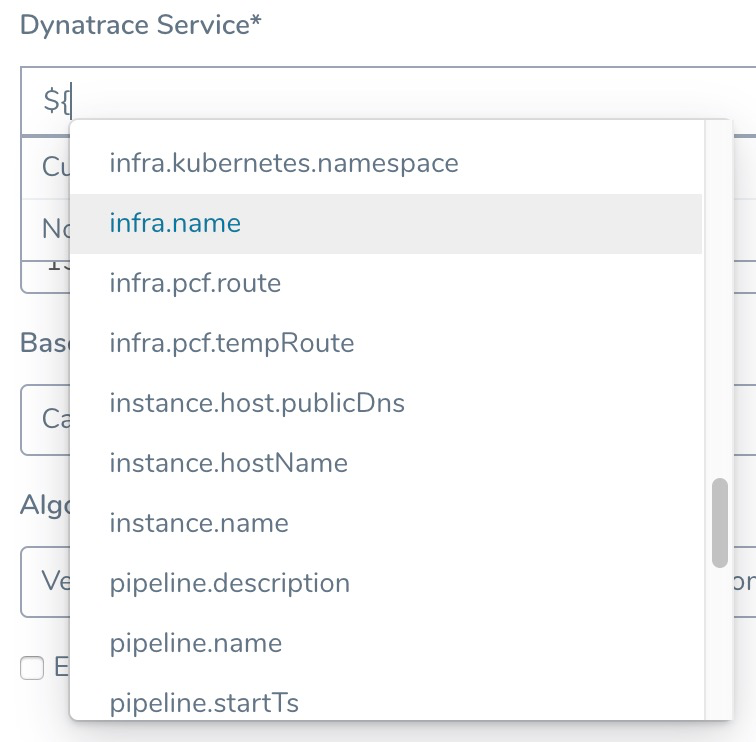
Expression support lets you template your Workflow verification steps. You can add custom expressions for settings, and then provide values for those settings at deployment runtime. Or you can use Harness built-in variable expressions and Harness will provide values at deployment runtime automatically.
Step 8: View Verification Results
Once you have deployed your Workflow (or Pipeline) using the Stackdriver verification step, you can automatically verify performance across your deployment. For more information, see Add a Workflow and Add a Pipeline.
Workflow Verification
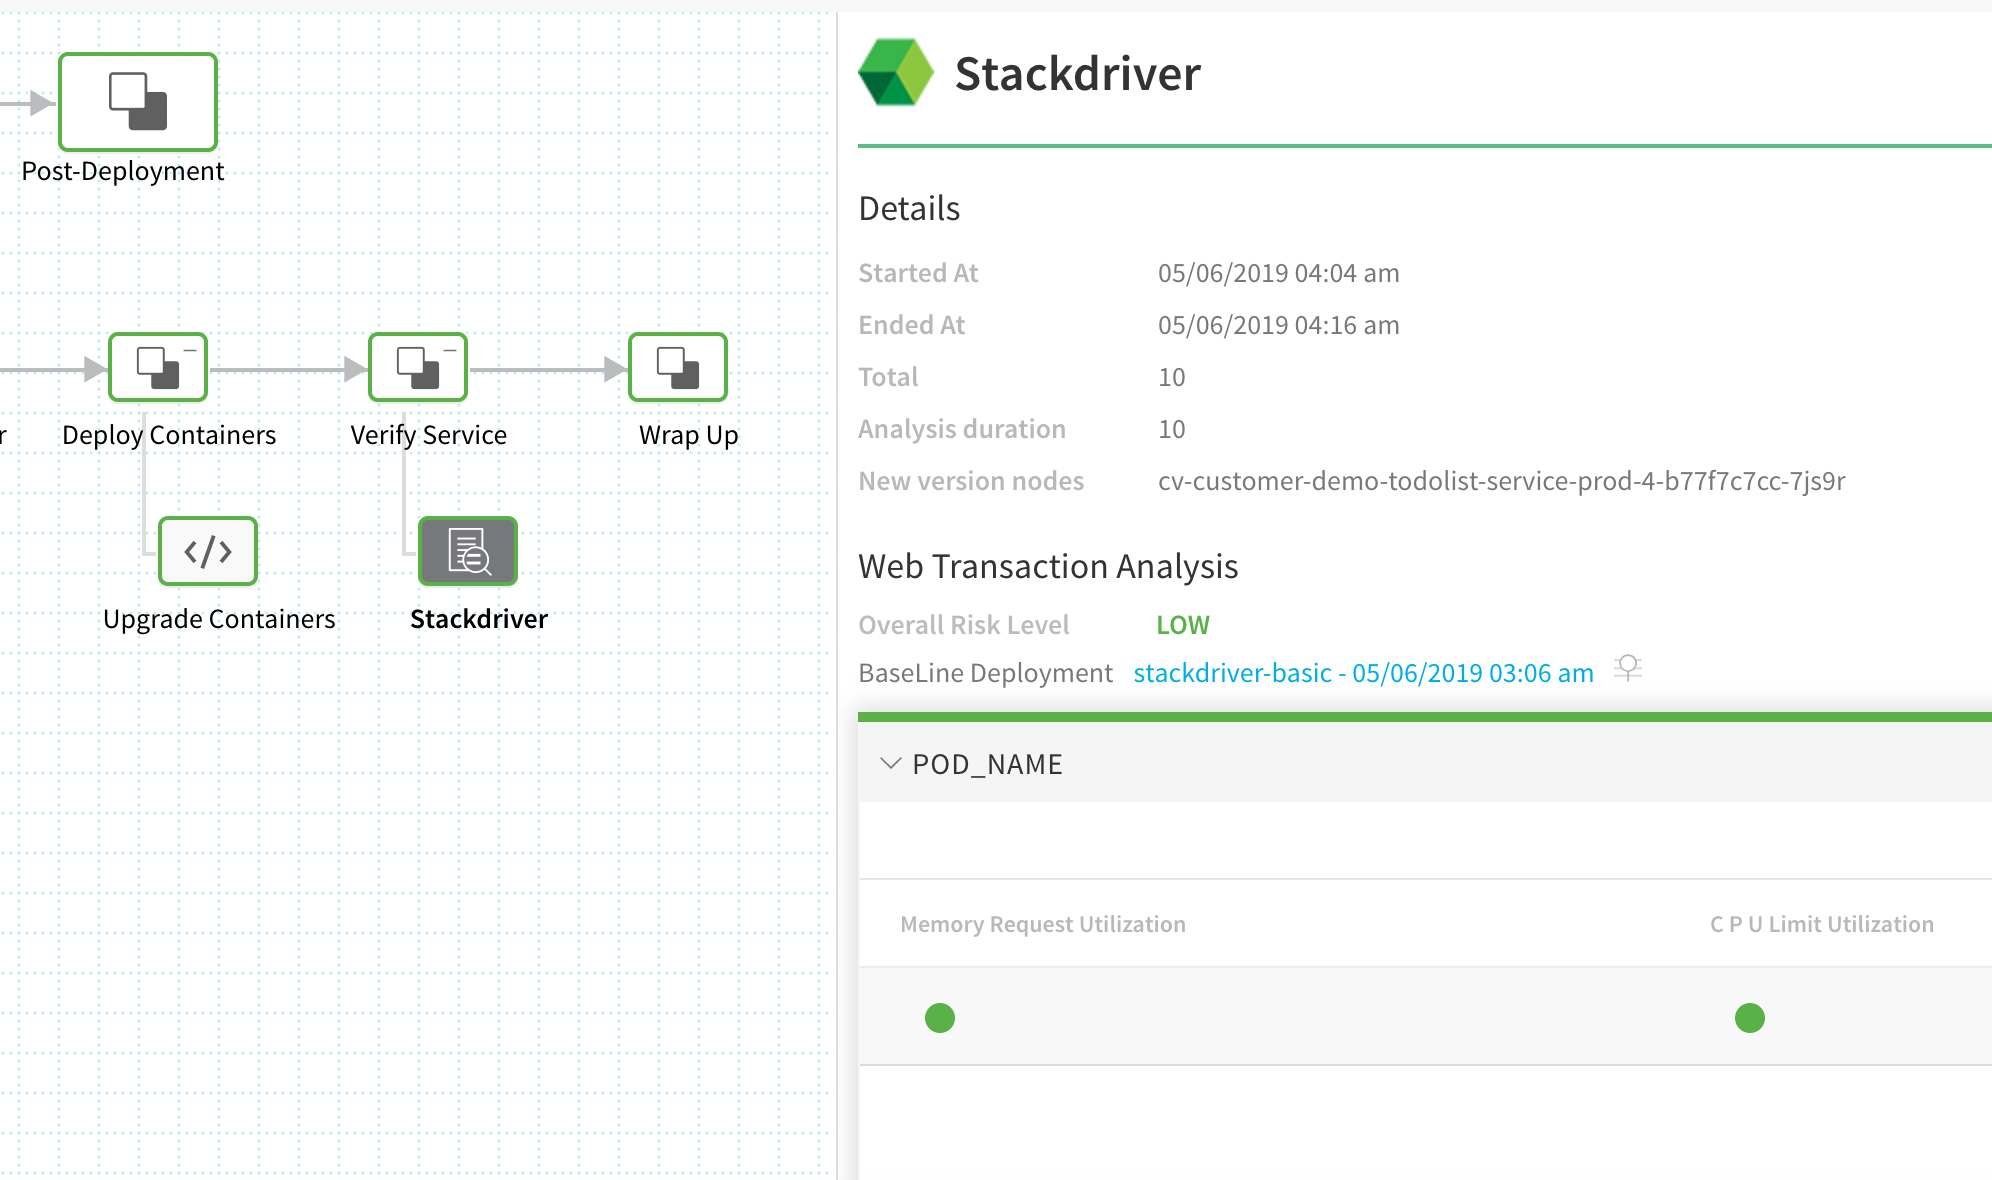
To see the results of Harness machine-learning evaluation of your Stackdriver verification, in your Workflow or pipeline deployment you can expand the Verify Service step and then click the Stackdriver step.
Continuous Verification
You can also see the evaluation in the Continuous Verification dashboard. The Workflow verification view is for the DevOps user who developed the Workflow. The Continuous Verification dashboard is where all future deployments are displayed for developers and others interested in deployment analysis.