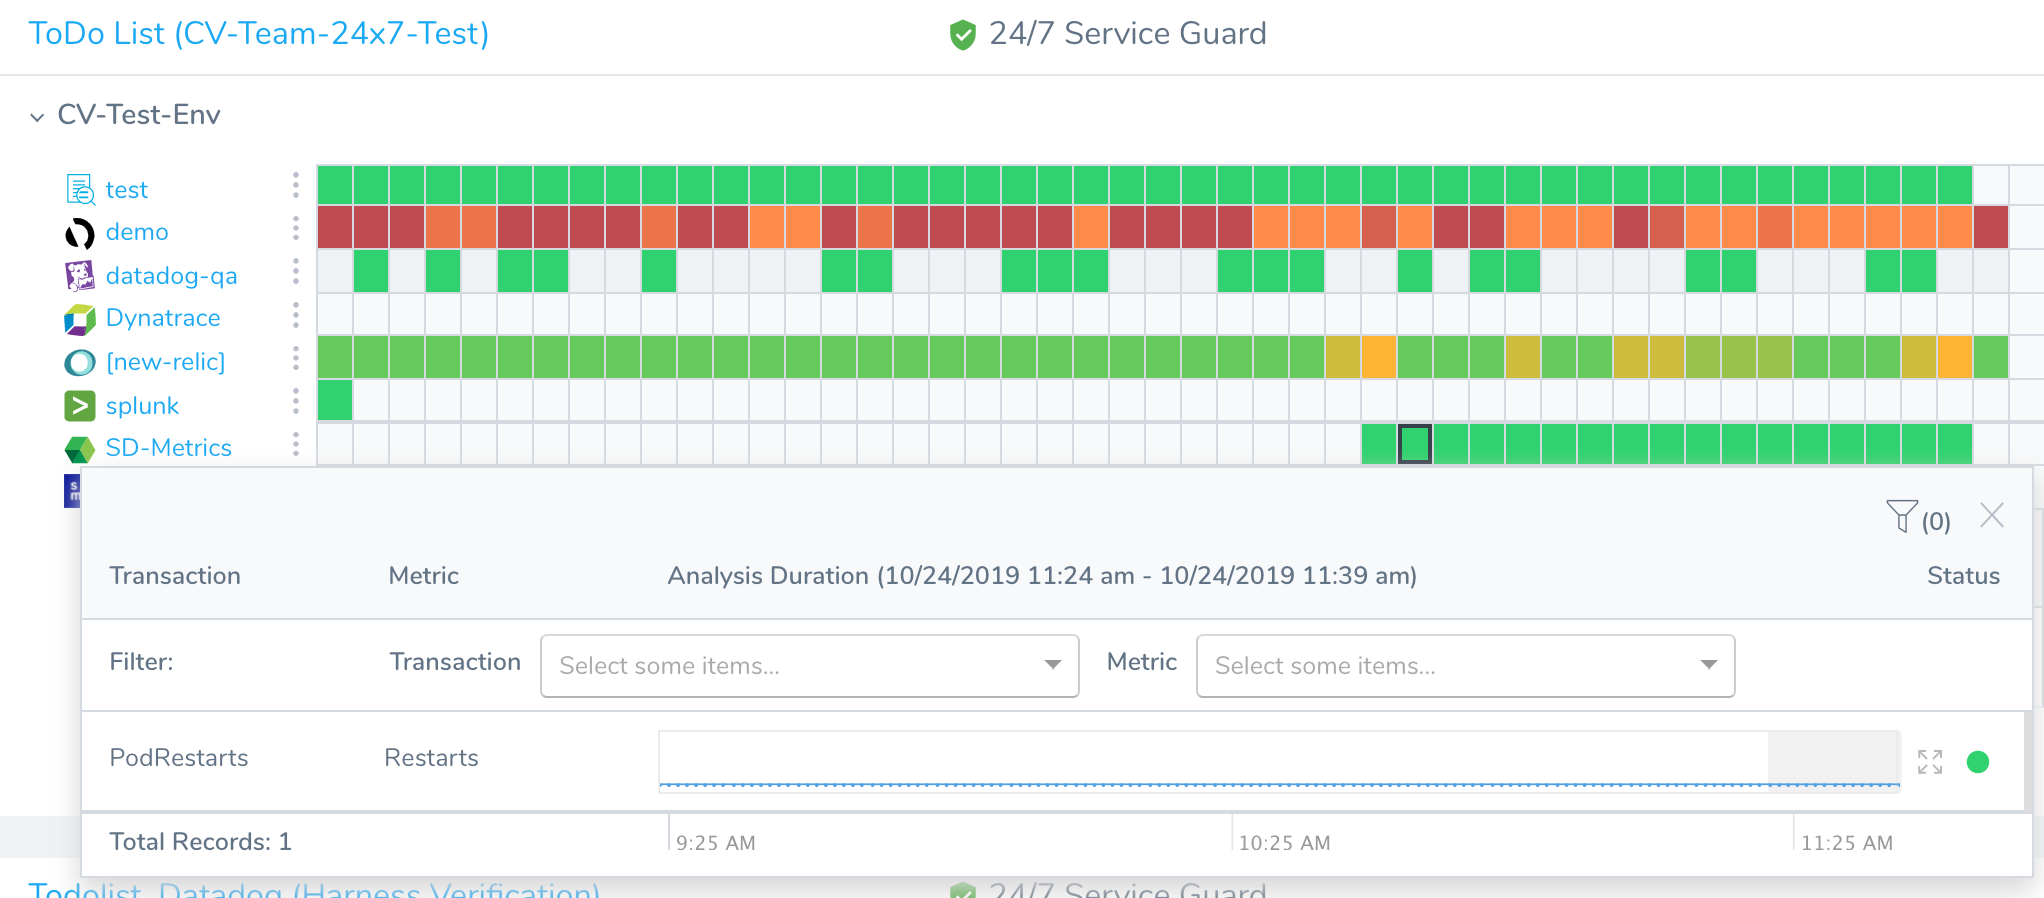
Monitor Applications 24/7 with Stackdriver Metrics
Harness 24/7 Service Guard monitors your live applications, catching problems that surface minutes or hours following deployment.
Once you have set up the Stackdriver Verification Provider in Harness, as described in Connect to Stackdriver, you can add your Stackdriver Metrics monitoring to Harness 24/7 Service Guard in your Harness Application Environment.
Before You Begin
- Set up a Harness Application, containing a Service and Environment. See Create an Application.
- See the Stackdriver Verification Overview.
Visual Summary
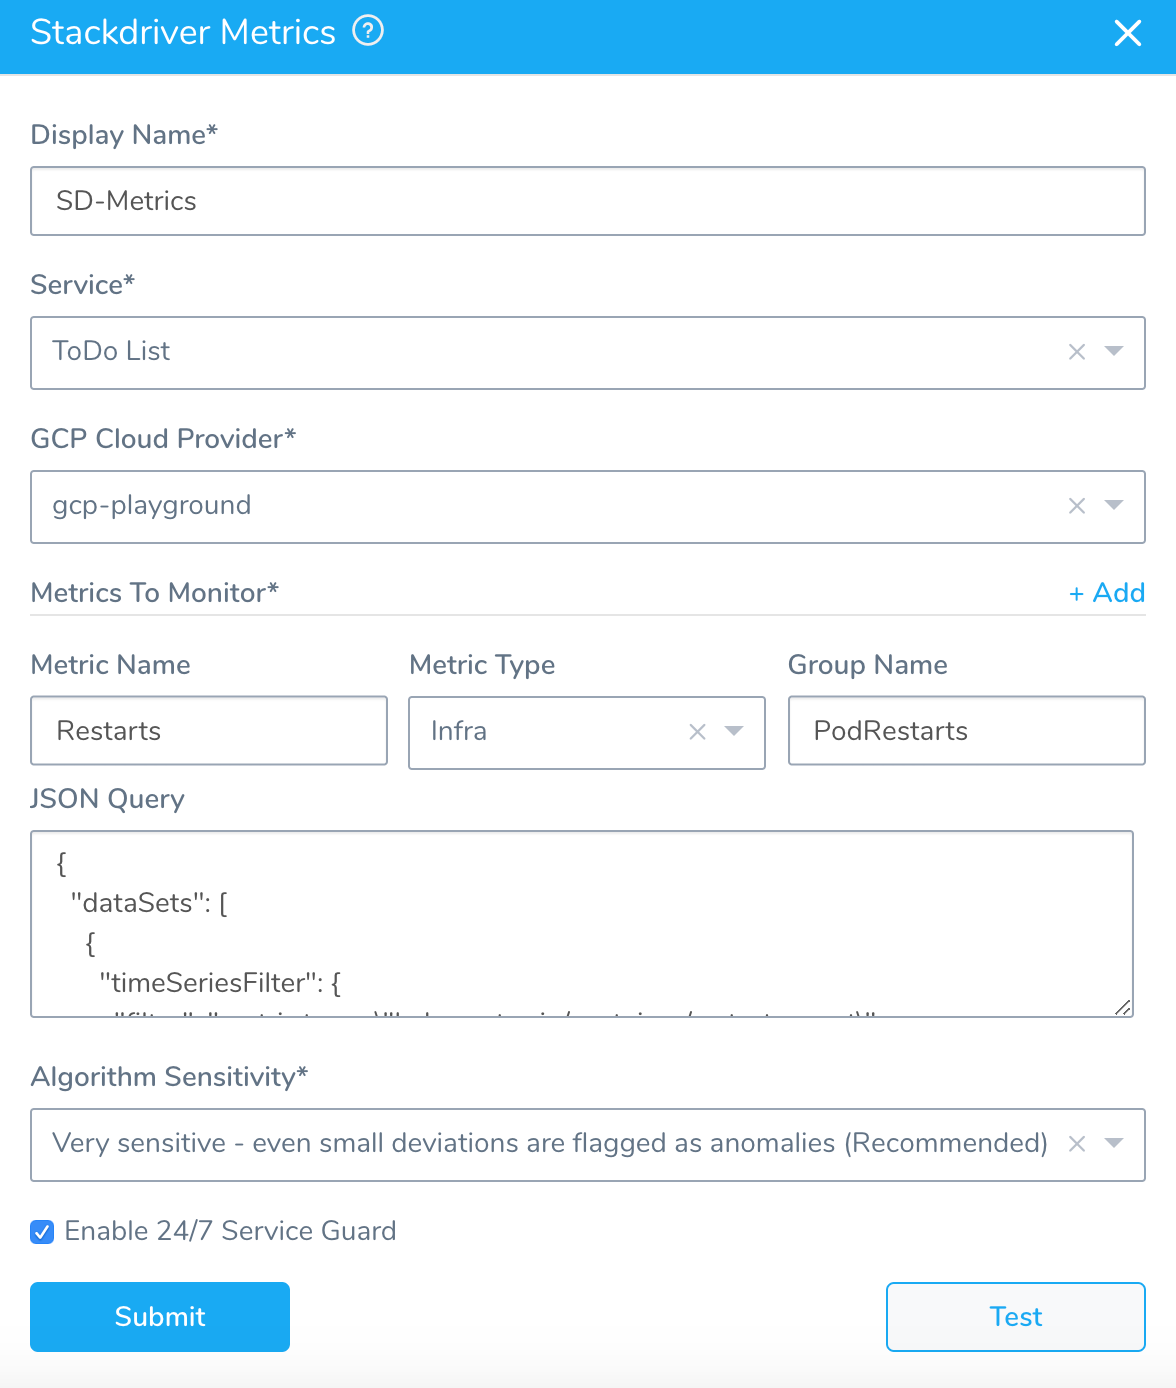
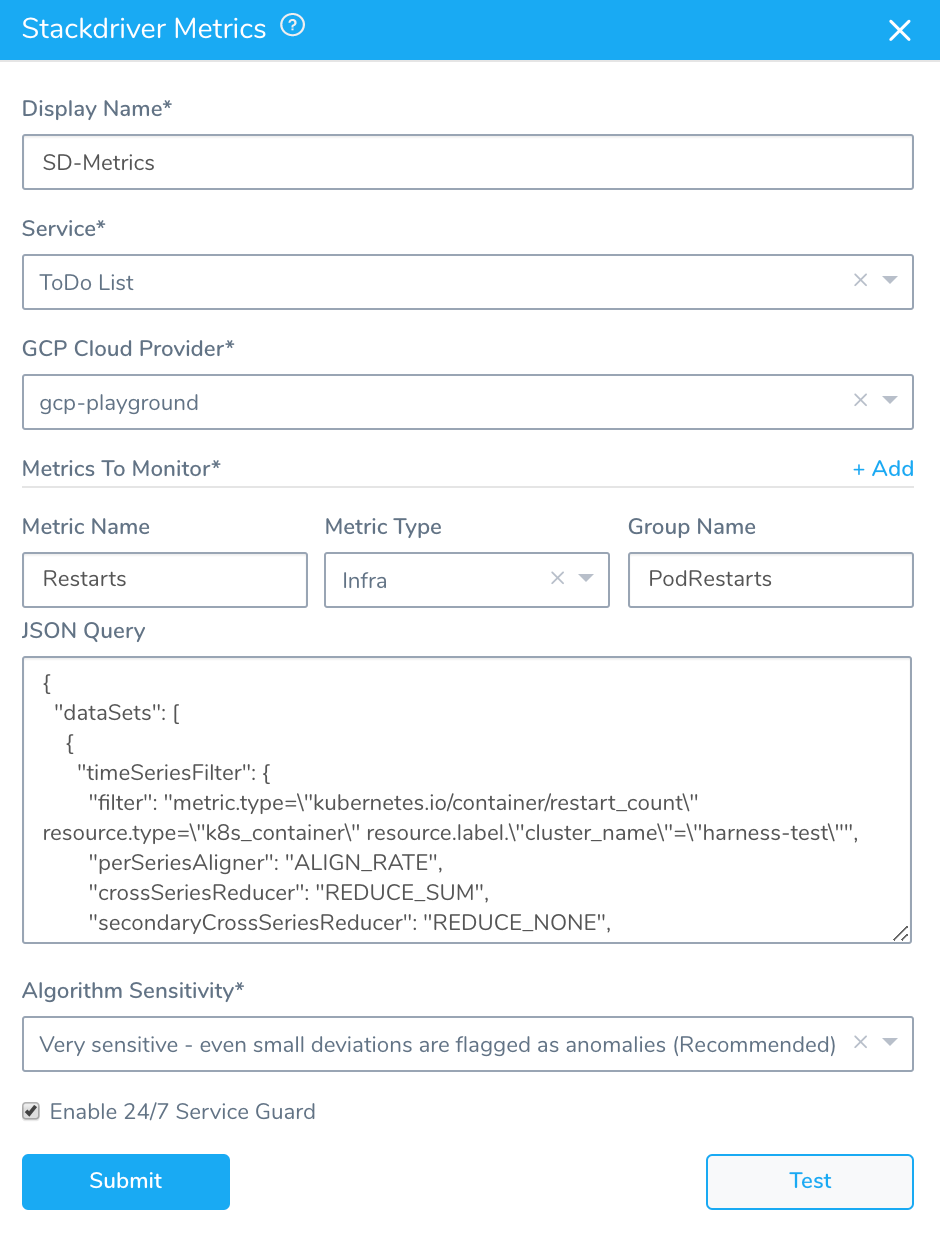
Here's an example of a completed Stackdriver Metrics for 24/7 Service Guard setup.
Step 1: Set up 24/7 Service Guard
To set up 24/7 Service Guard for Stackdriver, do the following:
- Ensure that you have added Stackdriver as a Harness Verification Provider, as described in Connect to Stackdriver.
- In your Harness Application, ensure that you have added a Service, as described in Services. For 24/7 Service Guard, you do not need to add an Artifact Source to the Service, or configure its settings. You simply need to create a Service and name it. It will represent your application for 24/7 Service Guard.
- In your Harness Application, click Environments.
- In Environments, ensure that you have added an Environment for the Service you added. For steps on adding an Environment, see Environments.
- Click the Environment for your Service. Typically, the Environment Type is Production.
- In the Environment page, locate 24/7 Service Guard.
- In 24/7 Service Guard, click Add Service Verification, and then click Stackdriver Metrics. The Stackdriver Metric dialog appears.
Step 2: Display Name
The name that will identify this service on the Continuous Verification dashboard. Use a name that indicates the environment and monitoring tool, such as Stackdriver.
Step 3: Service
The Harness Service to monitor with 24/7 Service Guard.
Step 4: GCP Cloud Provider
Select the GCP Cloud Provider to use, as described in Connect to Stackdriver. If you currently connect to GCP via a Kubernetes Cluster Cloud Provider, you must set up a GCP Cloud Provider for access to the Stackdriver data on your cluster.
Step 5: Metrics to Monitor
In this section you define the Stackdriver metrics you want to monitor. For example, here is a Stackdriver Metrics Explorer configured to monitor Kubernetes container restarts, filtered by a cluster name and grouped by cluster.
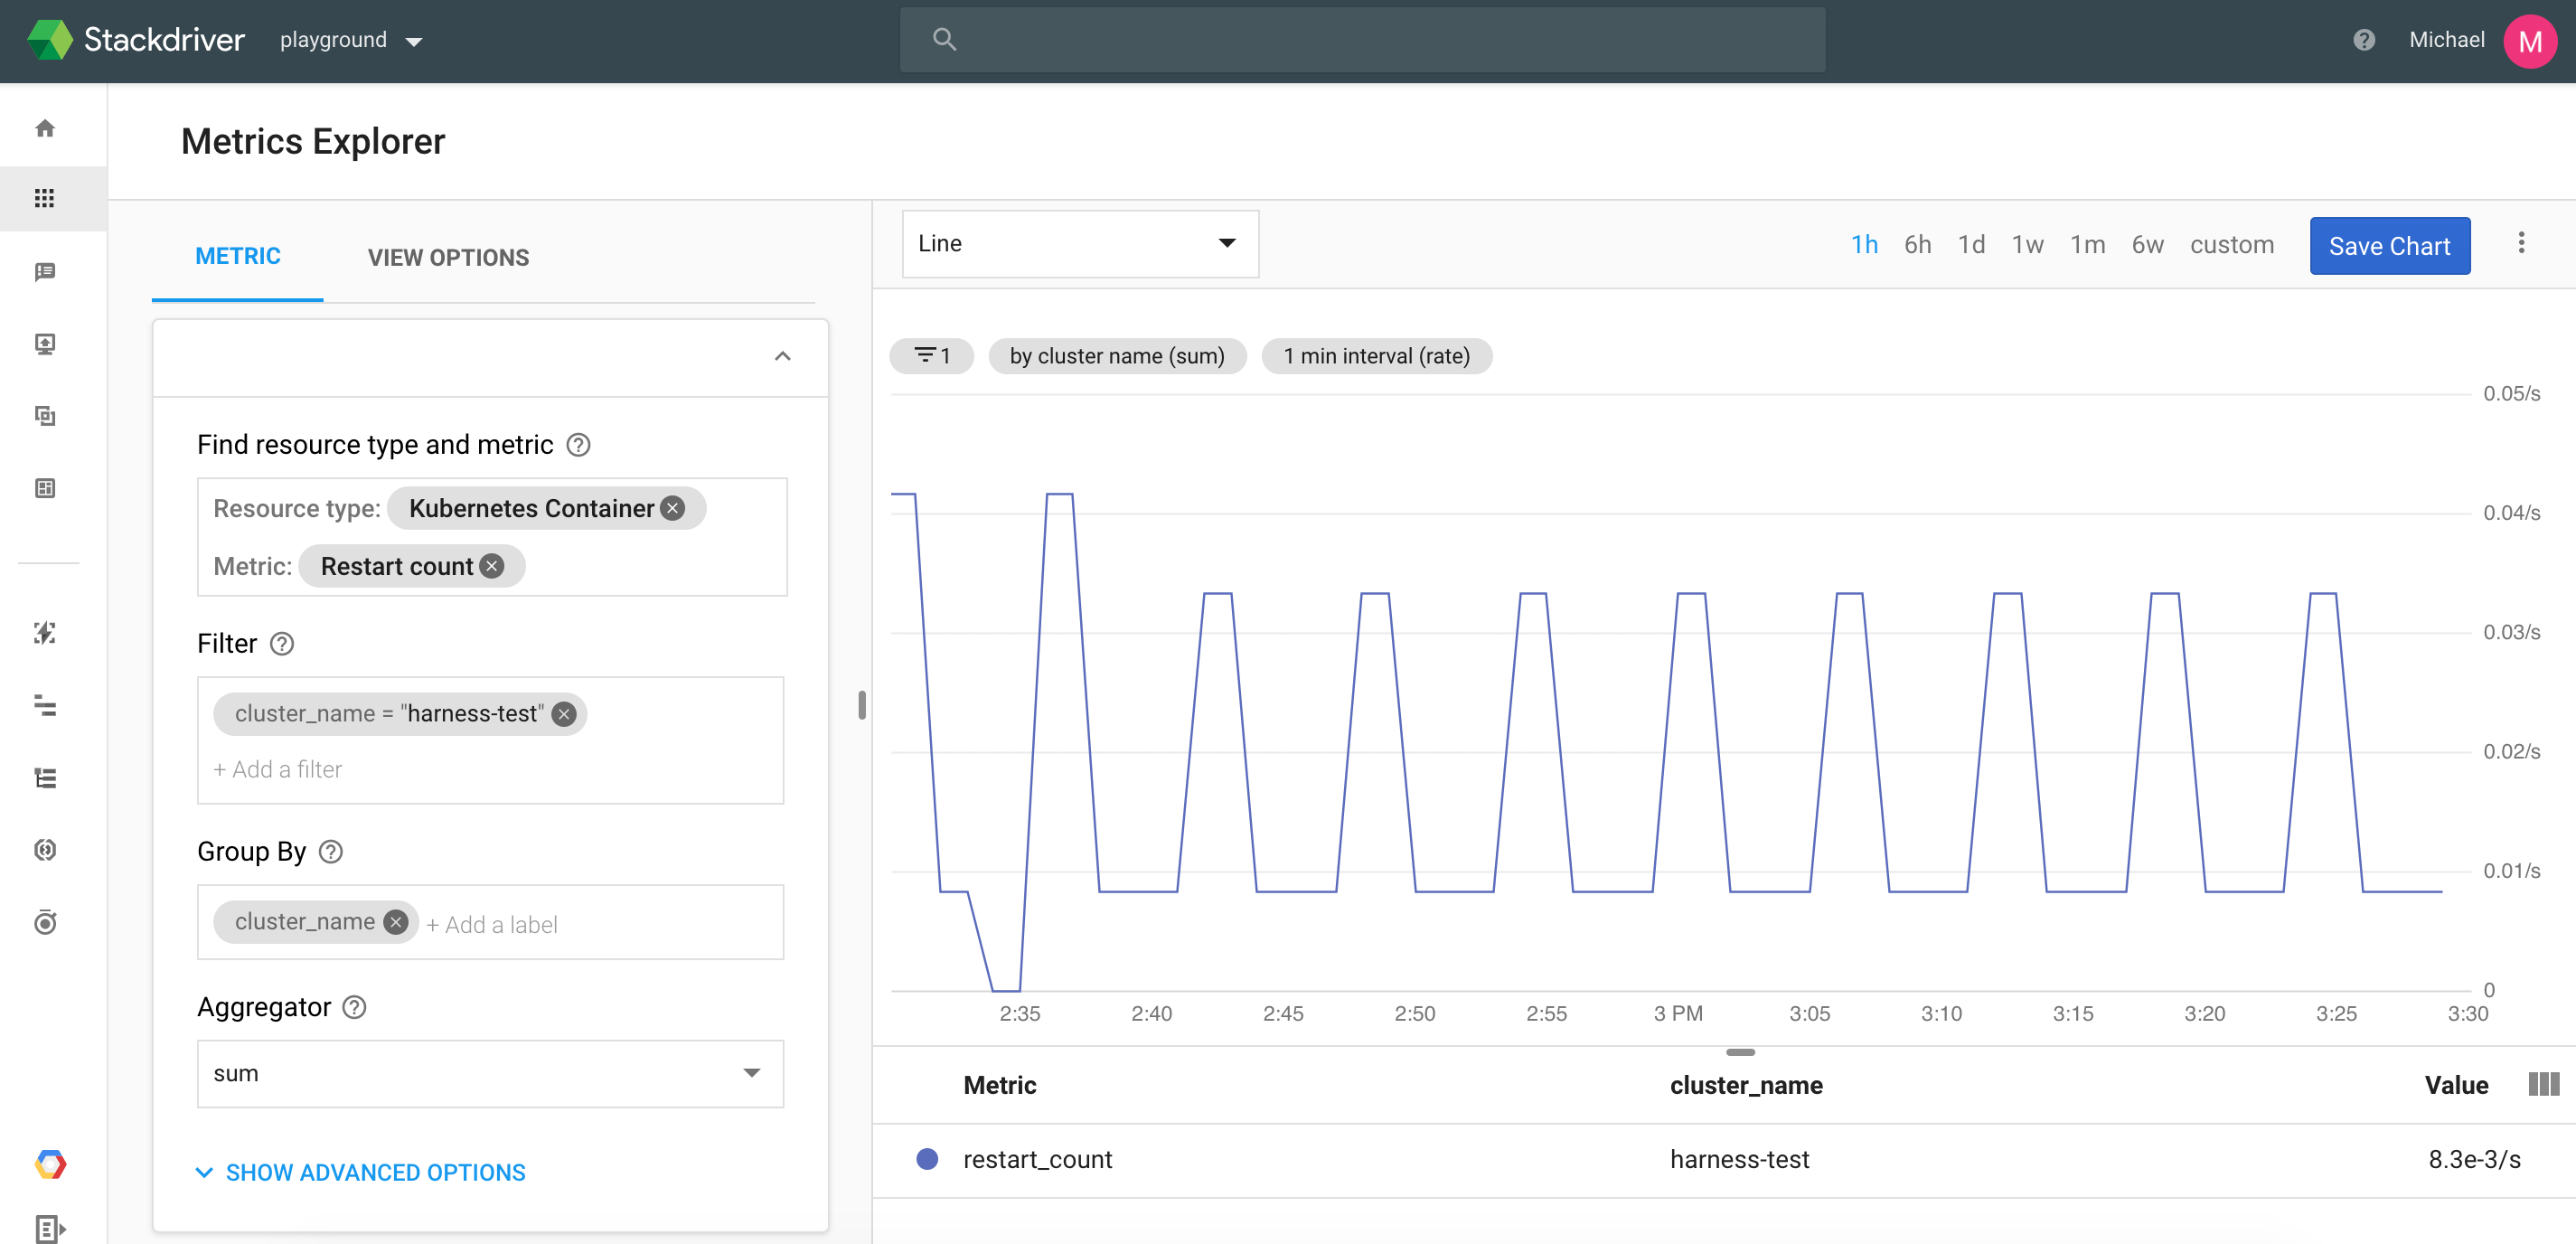
To reproduce these settings in Metrics To Monitor, you simply copy its filter and group by details via its JSON.
Step 6: Metric Name, Metric Type, and Group Name
In Metric Name, enter a name to identify the metric in Harness, such as Restarts. This is not the Stackdriver-specific name of a metric.
In Metric Type, select the type of metric to monitor, such as Infra.
In Group Name, enter a name for grouping the metrics in Harness, such as PodRestarts. The Group Name is useful when you want Harness to monitor multiple metrics, and be able to group them.
Step 7: JSON Query
Paste in the JSON query from Stackdriver Metrics Explorer.
In Stackdriver Metrics Explorer, once you have your metric query set up, click the View as JSON option.
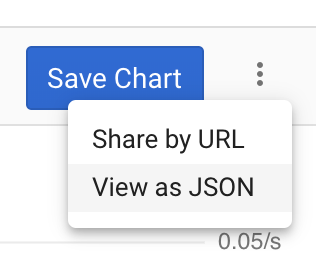
Next, click COPY JSON.
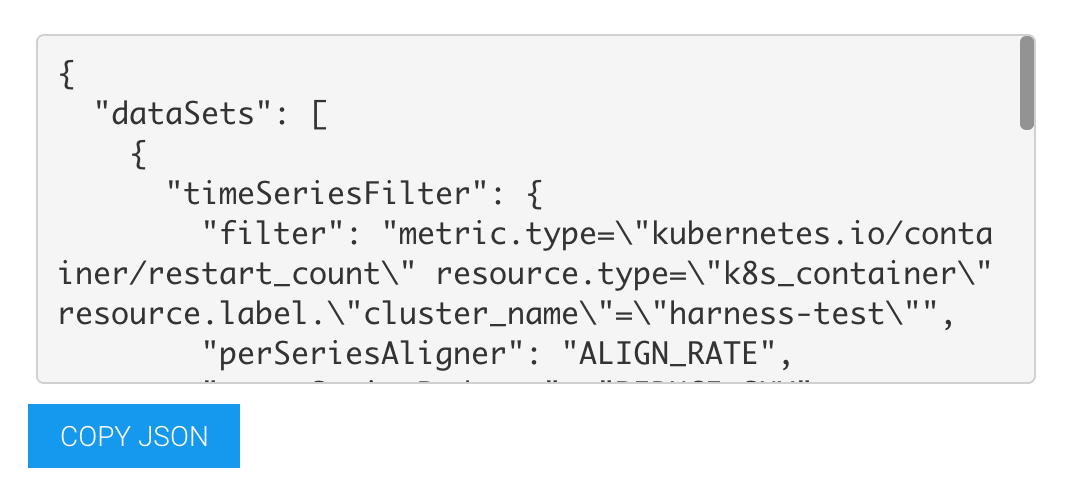
In Harness Stackdriver Metrics, in JSON Query, paste in the JSON.
Step 8: Algorithm Sensitivity
See CV Strategies, Tuning, and Best Practices.
Step 9: Enable 24/7 Service Guard
Click the checkbox to enable 24/7 Service Guard.
When you are finished, the dialog will look something like this:
Step 10: Verify Your Settings
Click TEST. Harness verifies the settings you entered.
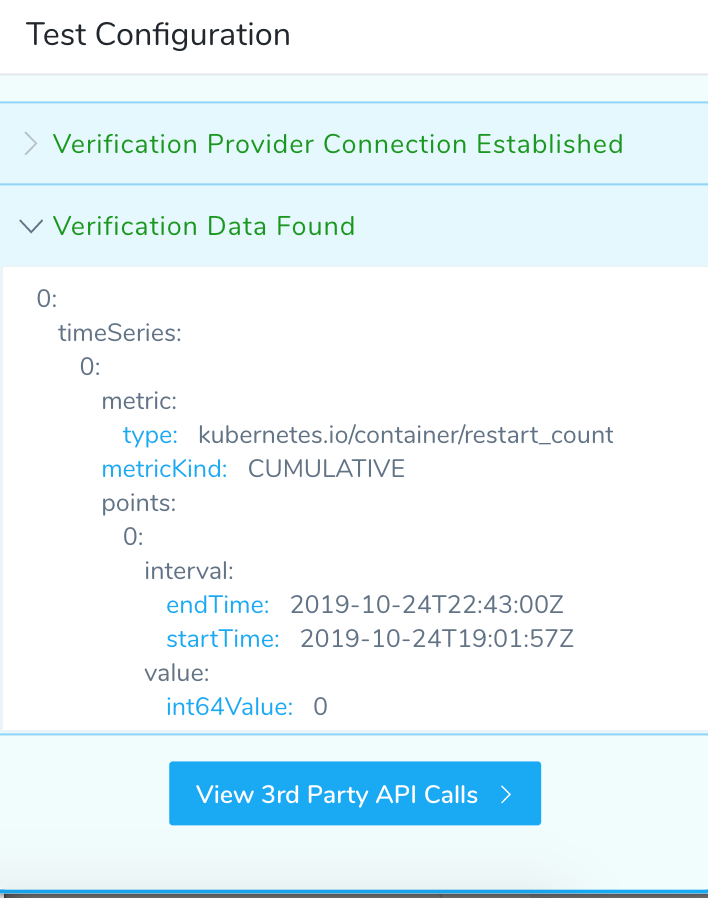
Click SUBMIT. The Stackdriver 24/7 Service Guard is configured.

To see the running 24/7 Service Guard analysis, click Continuous Verification. The 24/7 Service Guard dashboard displays the production verification results.
