Verify Deployments with AppDynamics as a Custom APM
After adding AppDynamics as a Custom Verification Provider, you can use it as a verification step in a Workflow. The following sections outline how to select the AppDynamics metrics you need.
Before You Begin
Step 1: Set Up the Deployment Verification
You can add verification steps to a Workflow after you have performed at least one successful deployment.To begin the Workflow setup:
- In Harness, open the Workflow that deploys the Service you will monitor with AppDynamics.
- In the Workflow, in Verify Service, click Add Step.
- In the resulting Add Step settings, select Performance Monitoring > Custom Metrics.
- Click Next. The Configure**Custom Metrics** settings appear.
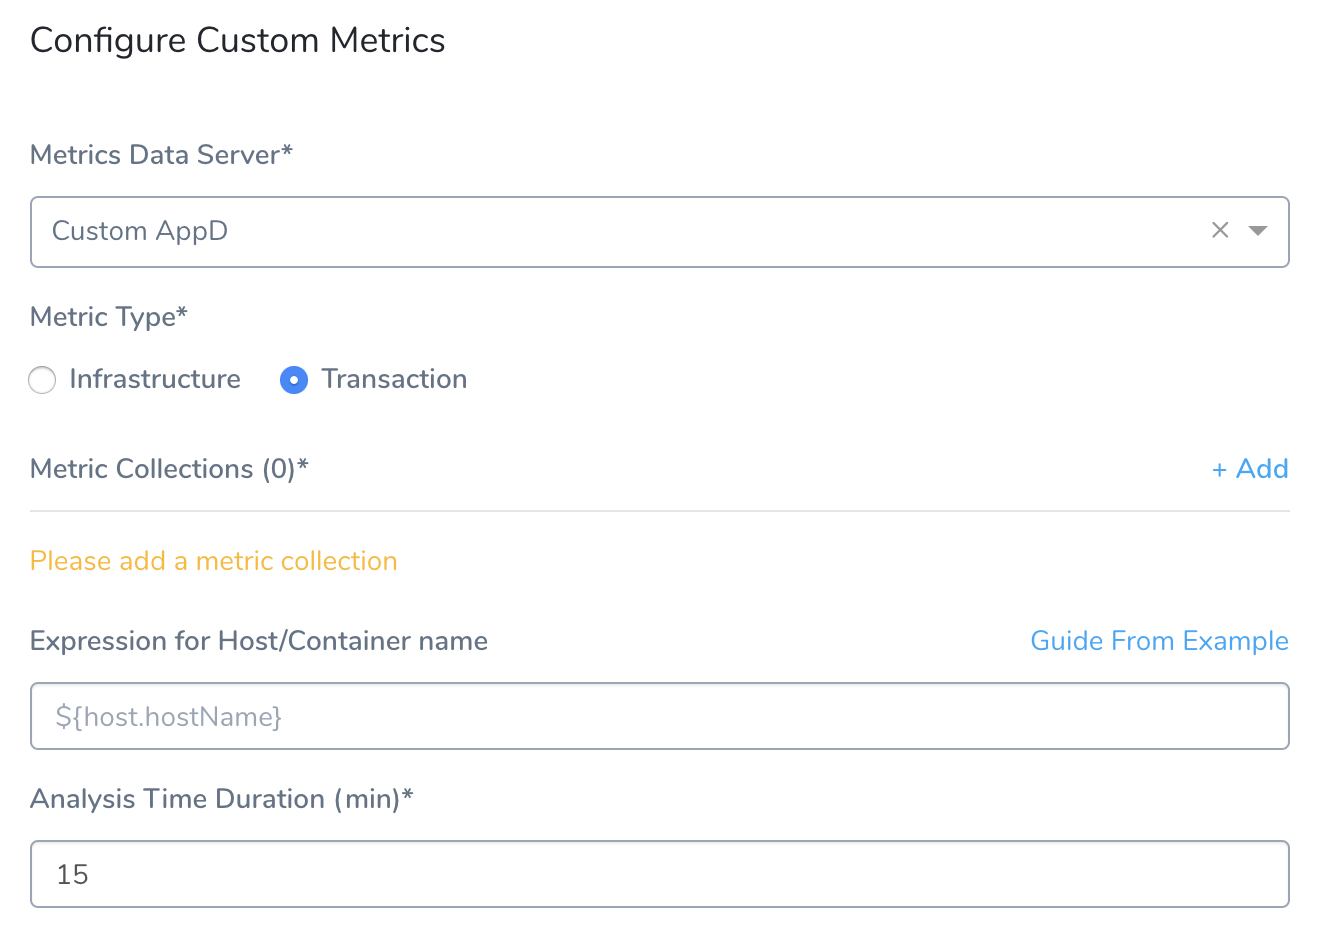
Step 2: Metrics Data Server
In the Metrics Data Server drop-down, select the Custom Verification Provider.
Step 3: Metric Type
Set the Metric Type to either Infrastructure or Transaction.
Your settings will now look something like this:
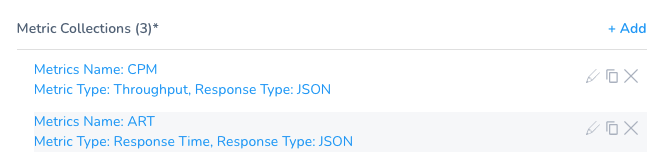
Step 4: Metric Collections
Beside Metric Collections, click Add to display the New Metrics Collection settings.
Most fields here define Harness settings for collecting and grouping metrics. The exceptions are settings where you will map JSON response keys to Harness fields.
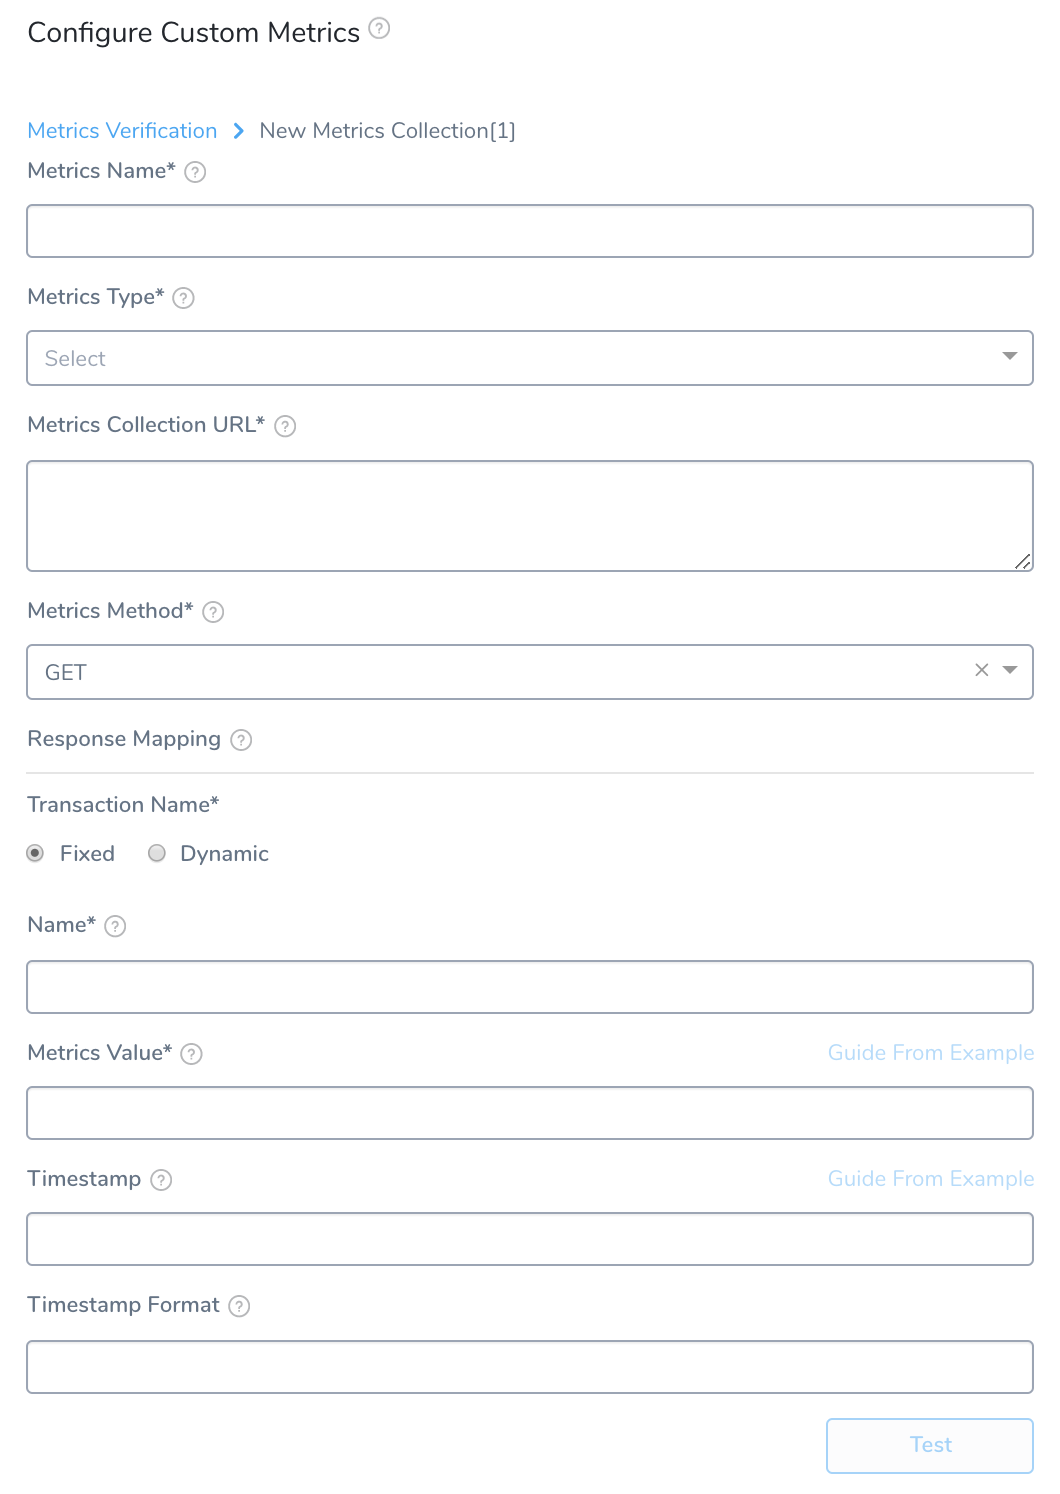
Fill out the New Metrics Collection settings using the following information.
Step 5: Metrics Name
Enter an arbitrary name for this metric. (This is not an AppDynamics value; it will be internal to Harness.)
Step 6: Metrics Type
Select the type of events you want to monitor. If you selected Infrastructure back in the Metrics Verification settings, your choices here are Infrastructure or Values. If you selected Transaction in the Metrics Verification settings, your choices here are Errors, Response Time, or Throughput.
Always Use Throughput with Error and Response Time Metrics
Whenever you use the Error metric type, you should also add another metric for Throughput with the same Transaction Name.
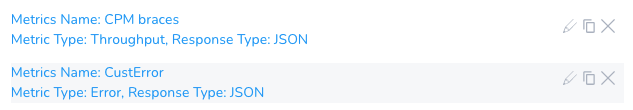
Harness analyze errors as error percentage and without the throughput the error number does not provide much information.
The same setup should used with the Response Time metric also. Whenever you set up a Response Time metric, setup a Throughput metric with the same Transaction Name.
Step 7: Metrics Collection URL
This is the API query that will return a JSON response. See the next section for details on setting up the query.
The query for the Metrics Collection URL follows this syntax:
rest/applications/cv-app/metric-data?metric-path=Business Transaction Performance|Business Transactions|<tier-name>|/<Business-Transaction-name>/<Metric-name>&time-range-type=BETWEEN_TIMES&start-time=${start_time}&end-time=${end_time}&output=JSON&rollup=false
Above, the values in <...> brackets are placeholders for parameters that you will define. The values in ${...} braces are placeholders used for querying the data, which will be substituted at runtime with real values. To build your literal query:
In the AppDynamics Metric Browser's Metric Tree, right-click the metric you want to monitor, and then select Copy REST URL.
In the example below, we've selected the Throughput metric/todolist/exception/Calls per Minute. Its REST URL is now on the clipboard: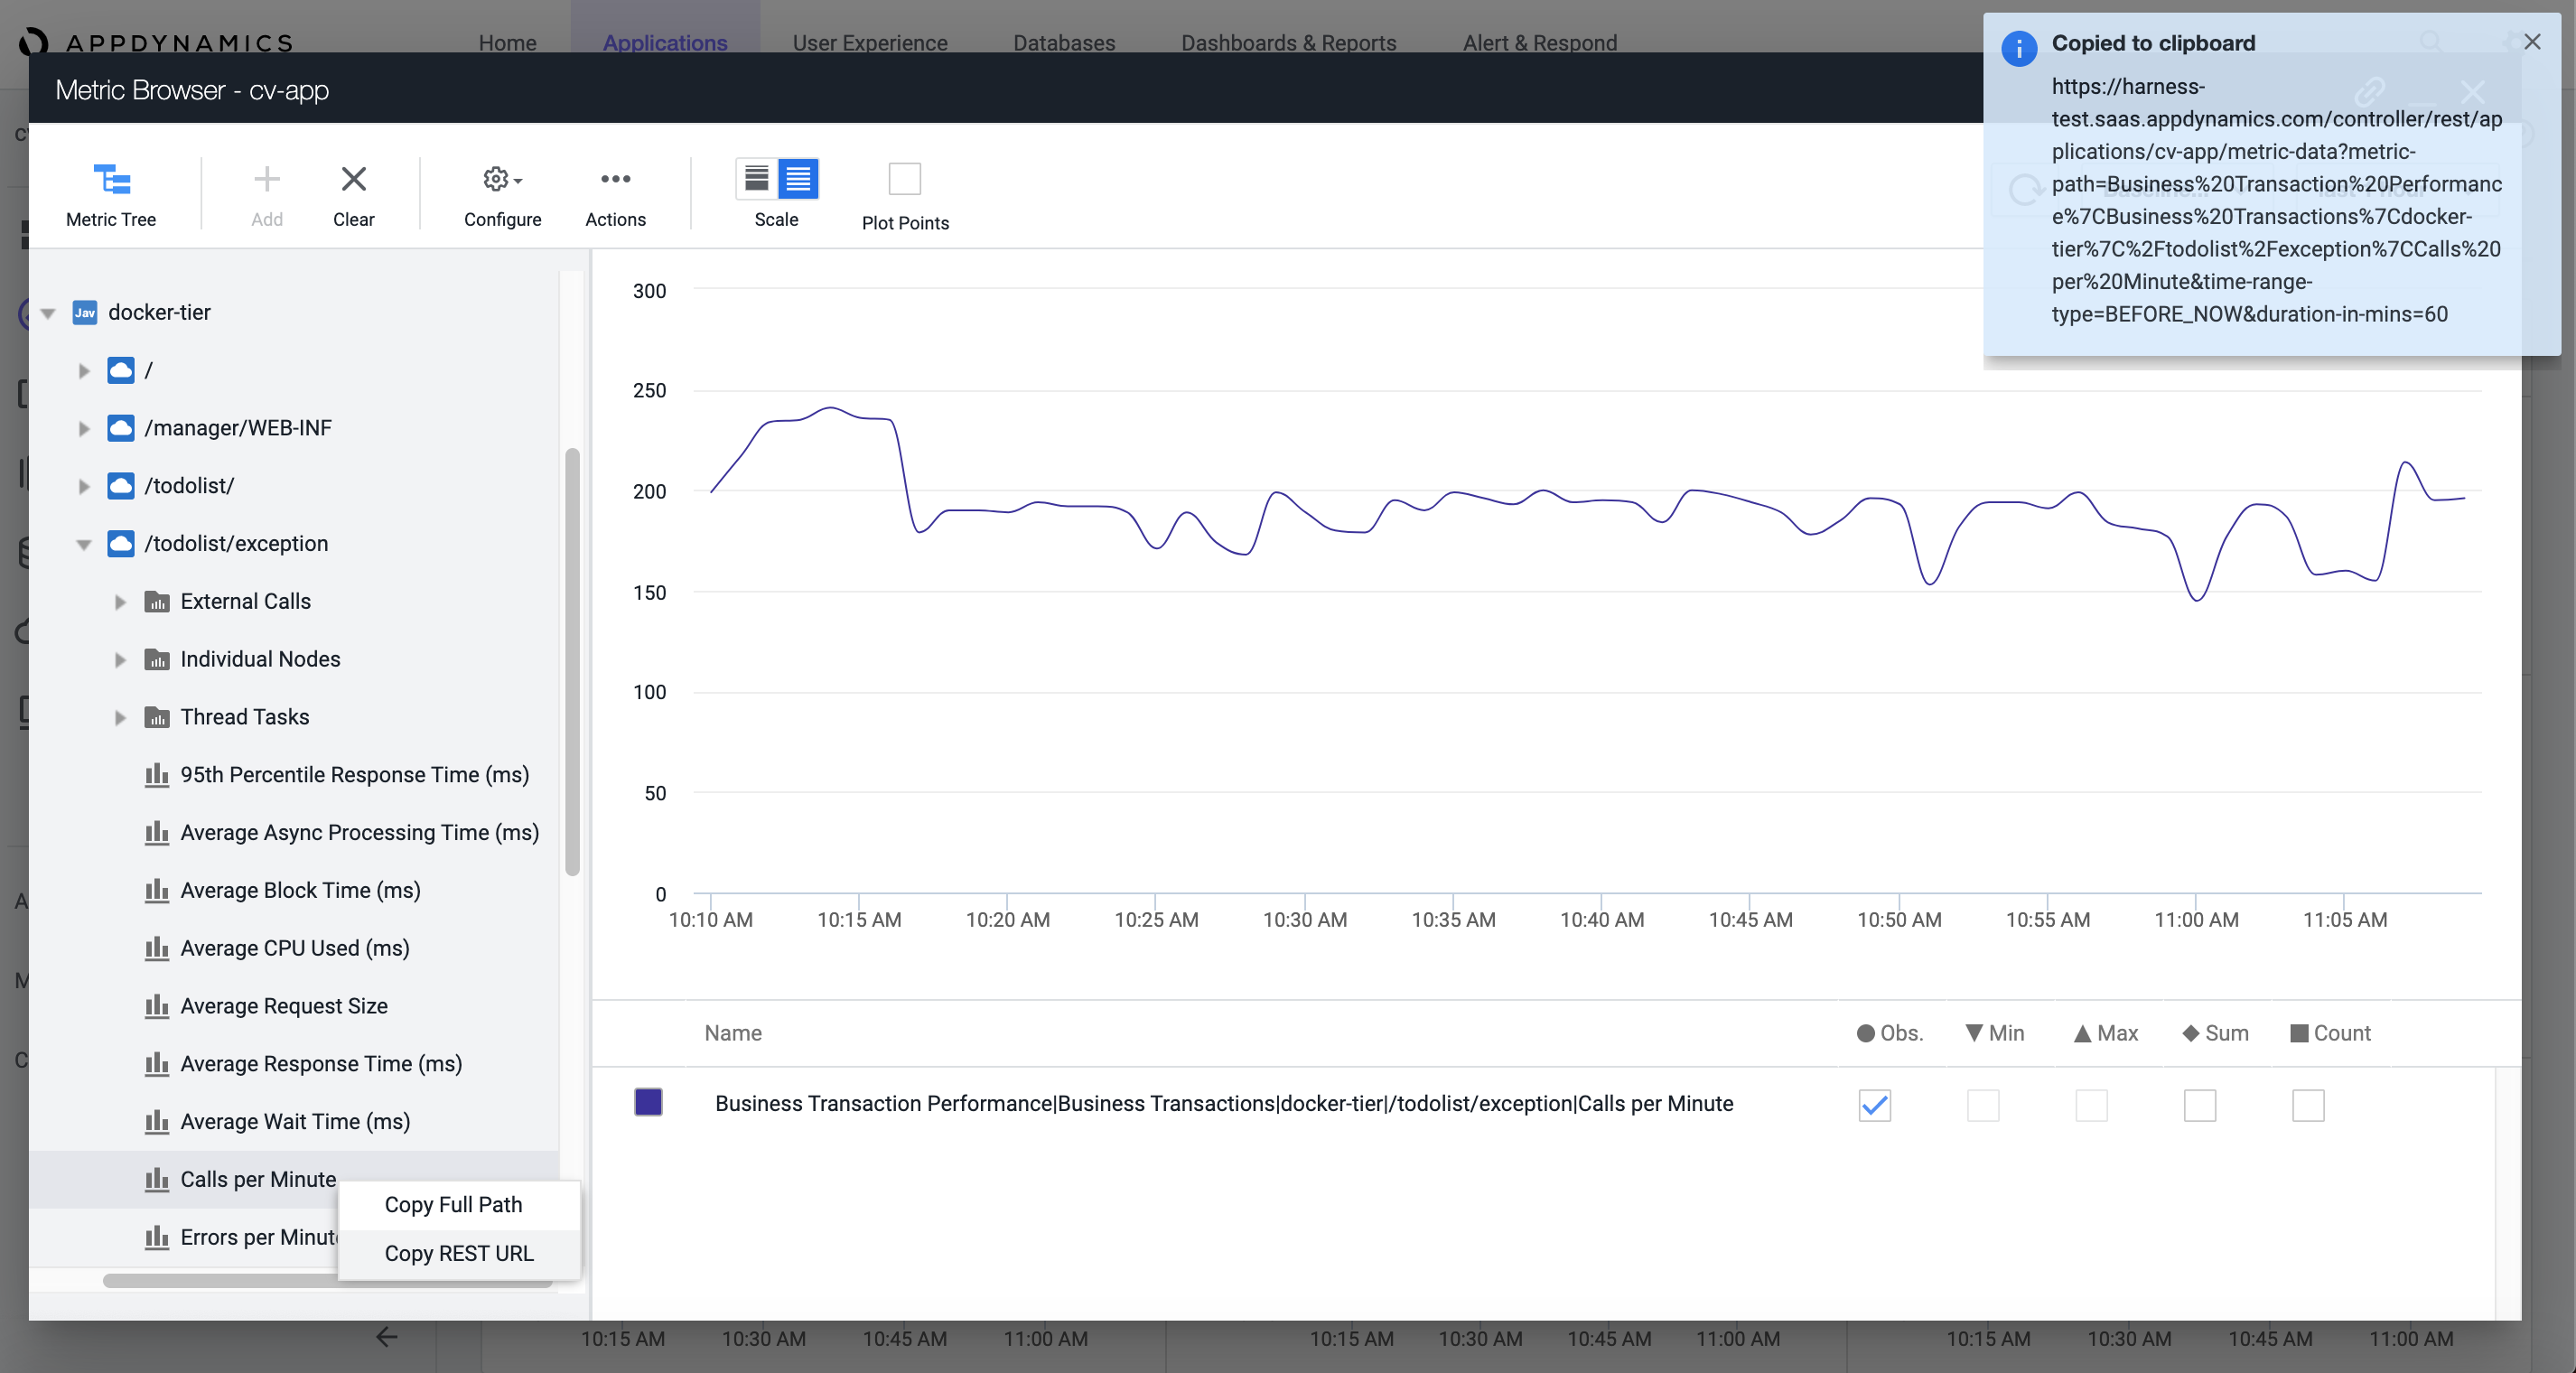
Paste the resulting URL into the Metrics Collection URL field.
Truncate the URL to the substring that follows
.../controller/.
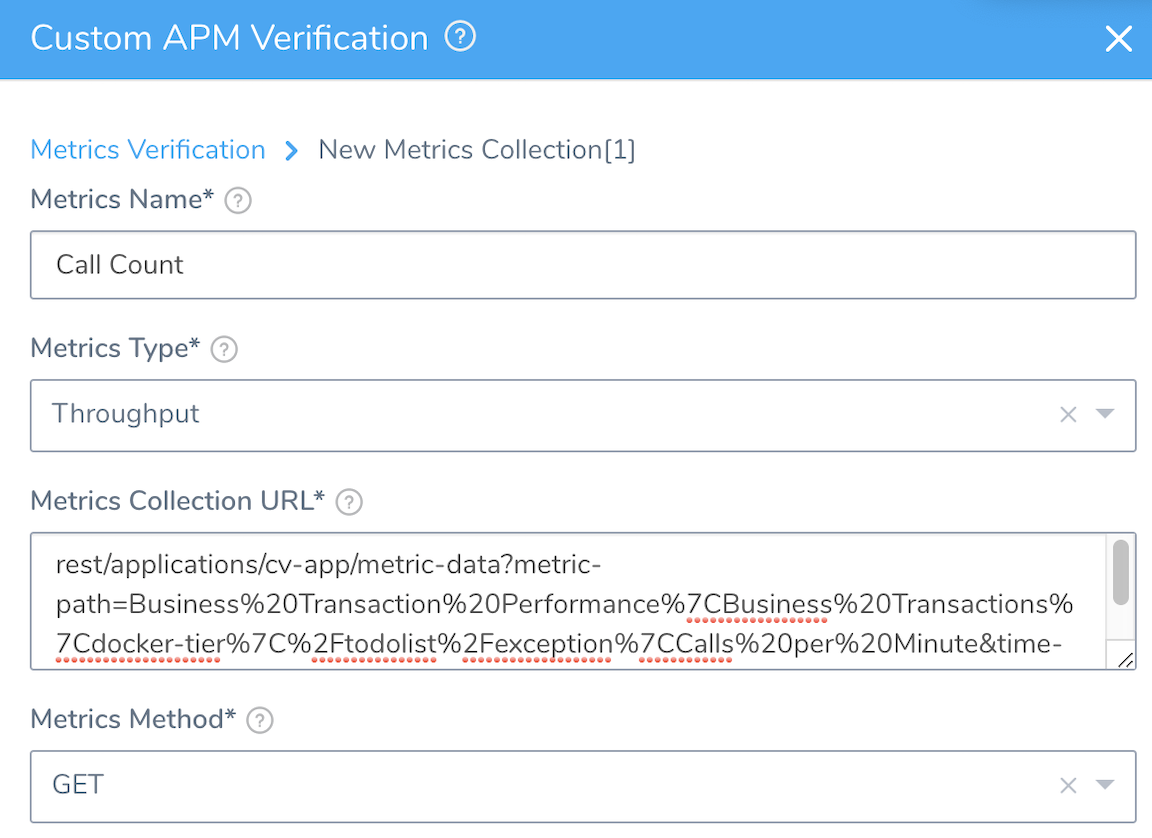
Your literal query—as copied, pasted into the Metrics Collection URL field, and then truncated—will now look something like this:
rest/applications/cv-app/metric-data?metric-path=Business%20Transaction%20Performance%7CBusiness%20Transactions%7Cdocker-tier%7C%2Ftodolist%2Fexception%7CCalls%20per%20Minute&time-range-type=BEFORE_NOW&duration-in-mins=60
At the end of the query, replace this substring from AppDynamics' default REST URL:
&time-range-type=BEFORE_NOW&duration-in-mins=60
...with this substring, whose ${...} placeholders are used to query for dynamic runtime data:
&time-range-type=BETWEEN_TIMES&start-time=${start_time}&end-time=${end_time}&output=JSON&rollup=false
Your literal query should now look something like this:
rest/applications/cv-app/metric-data?metric-path=Business%20Transaction%20Performance%7CBusiness%20Transactions%7Cdocker-tier%7C%2Ftodolist%2Fexception%7CCalls%20per%20Minute&time-range-type=BETWEEN_TIMES&start-time=${start_time}&end-time=${end_time}&output=JSON&rollup=false
Next, you will refine your query by specifying the REST method, and by mapping response keys to Harness fields.
Step 8: Metrics Method
In the Metrics Method drop-down, select either GET or POST, depending on the metric you're monitoring.
If you select POST here, the Metric Collection Body field appears. Enter the JSON body to send as a payload when making a REST call to AppDynamics. For details, see Verify Deployments with Custom APMs and Logs.The remaining Metrics Collection settings map the keys in the JSON response to Harness fields.
Step 9: Transaction Name
Select Fixed or Dynamic, depending on the transaction name. In our example, we will use Fixed.
If you select Dynamic, you will see the Transaction Name Path and Regex to transform Transaction Name fields. The Transaction Name Path is filled out in the same way as Name field listed just below. You use Regex to transform Transaction Name to truncate the value of the Transaction Name Path, if needed.
Step 10: Name
Enter the Business Transaction name, as it appears in the AppDynamics Metric Tree. In this example, you would enter: /todolist/exception.
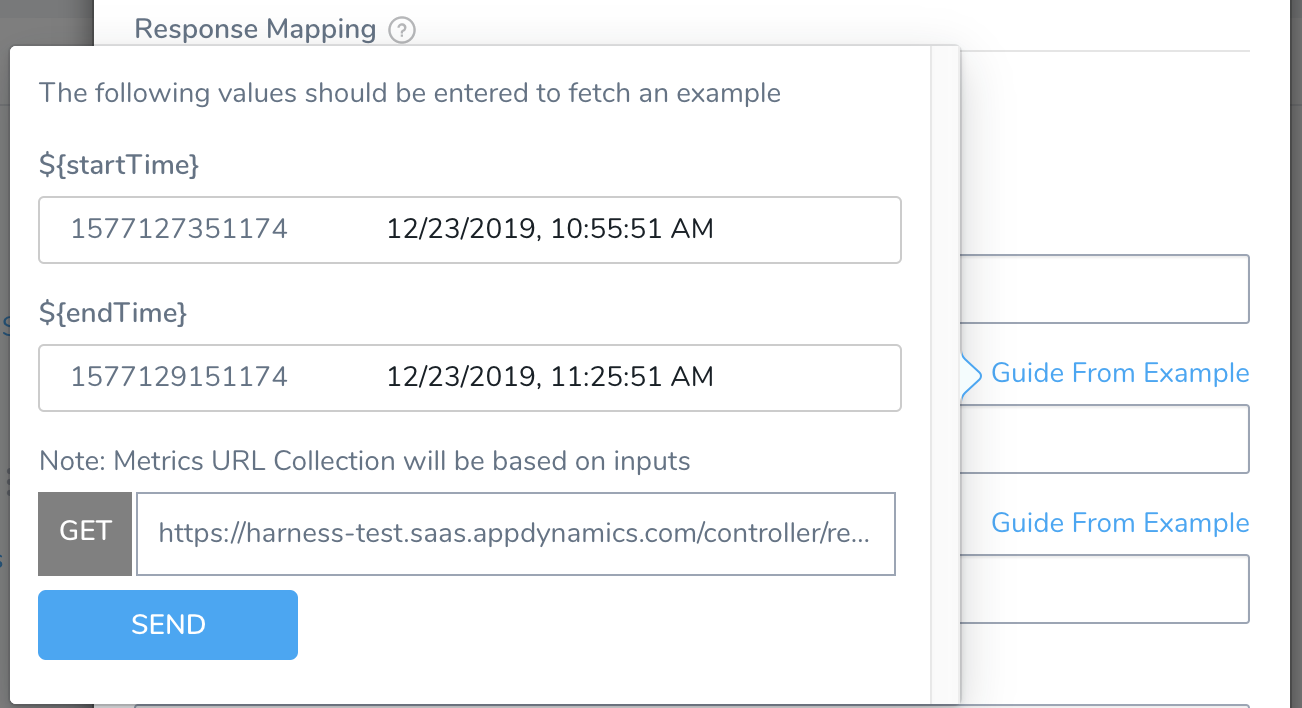
Step 11: Metrics Value
To map this value, run the query: Click Guide from Example, then click SEND from the resulting pop-up:
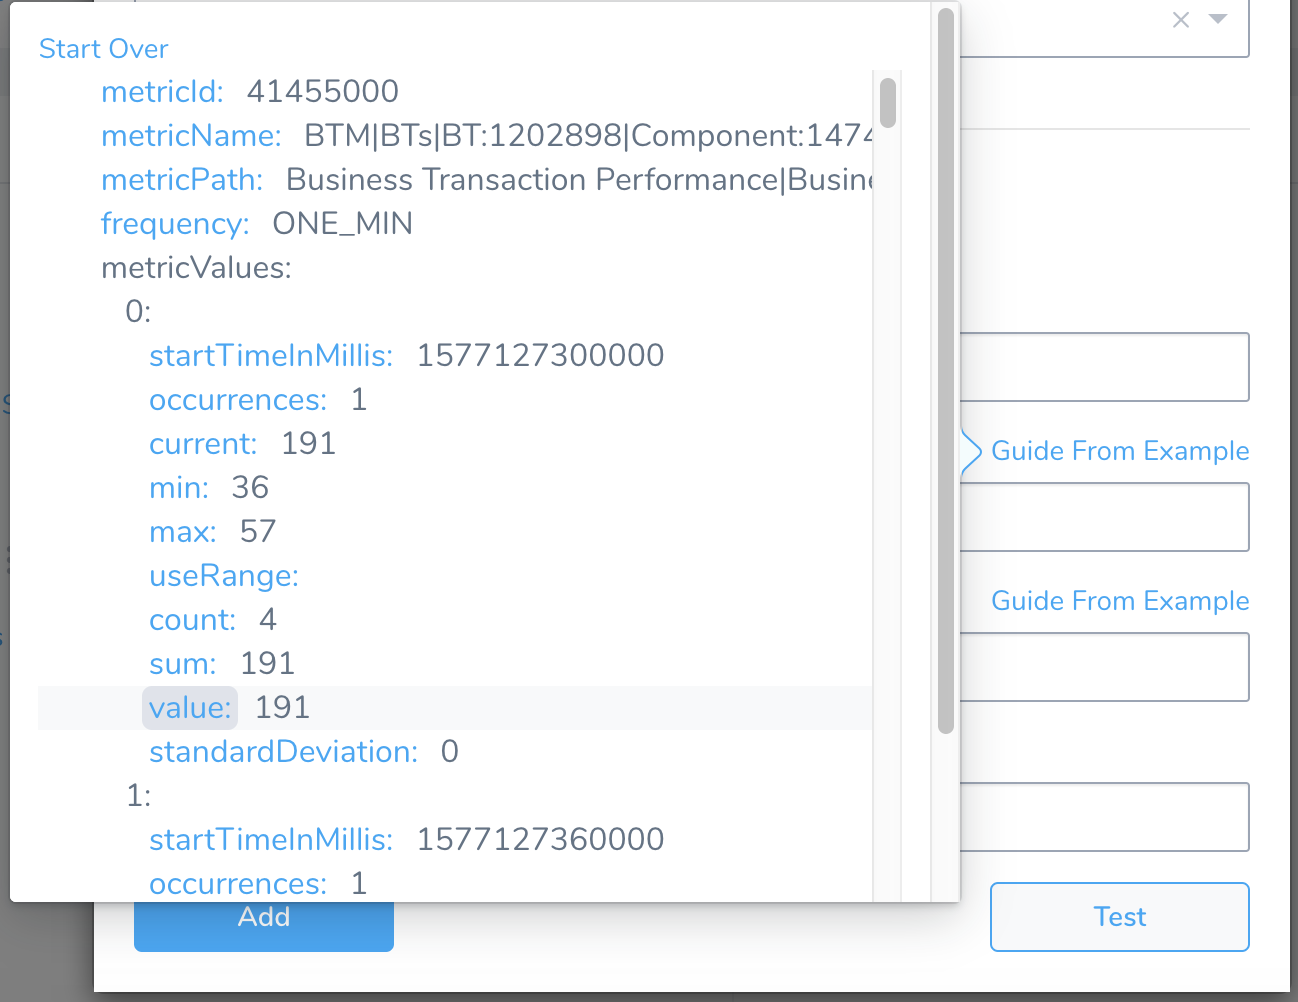
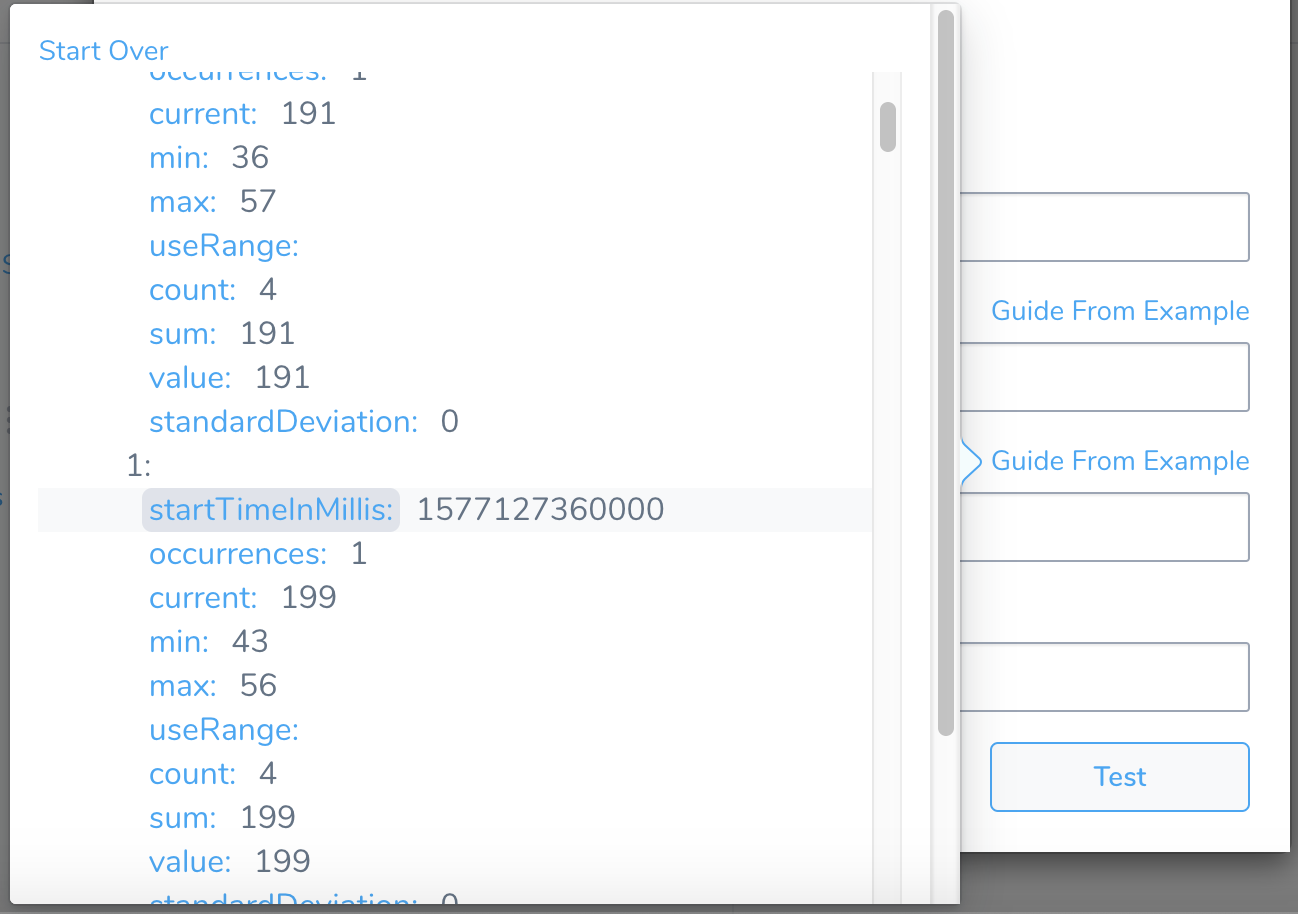
In the JSON response, click the value key. This maps it into Harness' Metrics Value field:
Step 12: Timestamp
As with the preceding field, click this field's Guide from Example link to query AppDynamics.

In the JSON response, click the startTimeInMillis key, which includes the timestamp. This maps this key to Harness' Timestamp field.
Step 13: Timestamp Format
Optionally, enter a timestamp format, following the Java SimpleDateFormat. An example timestamp syntax might be yyyy-MM-dd'T'HH:mm:ss.SSSX. If you leave this field empty, Harness will use the default range of 1 hour previous (now-1h) to now.
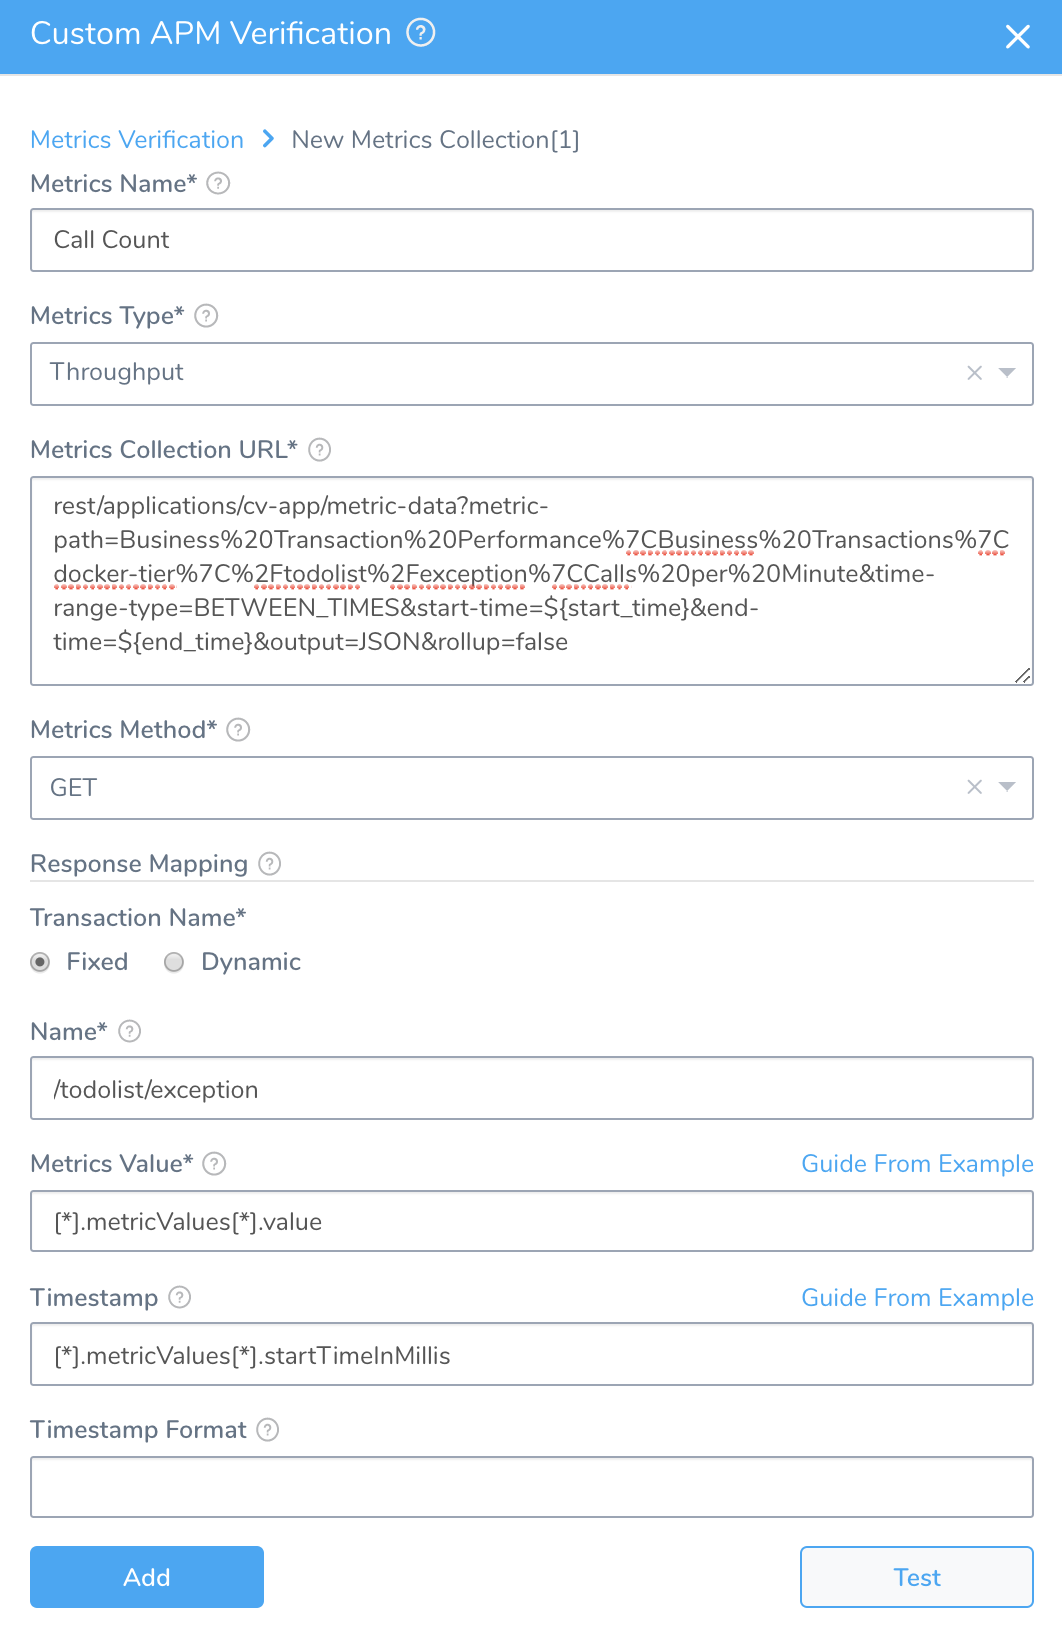
When you've filled in all the required Metrics Collection parameters, your query string in the Metrics Collection URL field will be modified to something like this:
rest/applications/cv-app/metric-data?metric-path=Business%20Transaction%20Performance%7CBusiness%20Transactions%7Cdocker-tier%7C%2Ftodolist%2Fexception%7CCalls%20per%20Minute&time-range-type=BETWEEN_TIMES&start-time=${start_time}&end-time=${end_time}&output=JSON&rollup=false
Your New Metrics Collection settings will now look something like this:
Click Test. If your configuration tests successfully, click Add to add this collection.
This returns you to the Custom APM Verification settings' initial Metrics Verification page, to fill in the remaining settings.
Fill in the remaining Metrics Verification settings as follows:
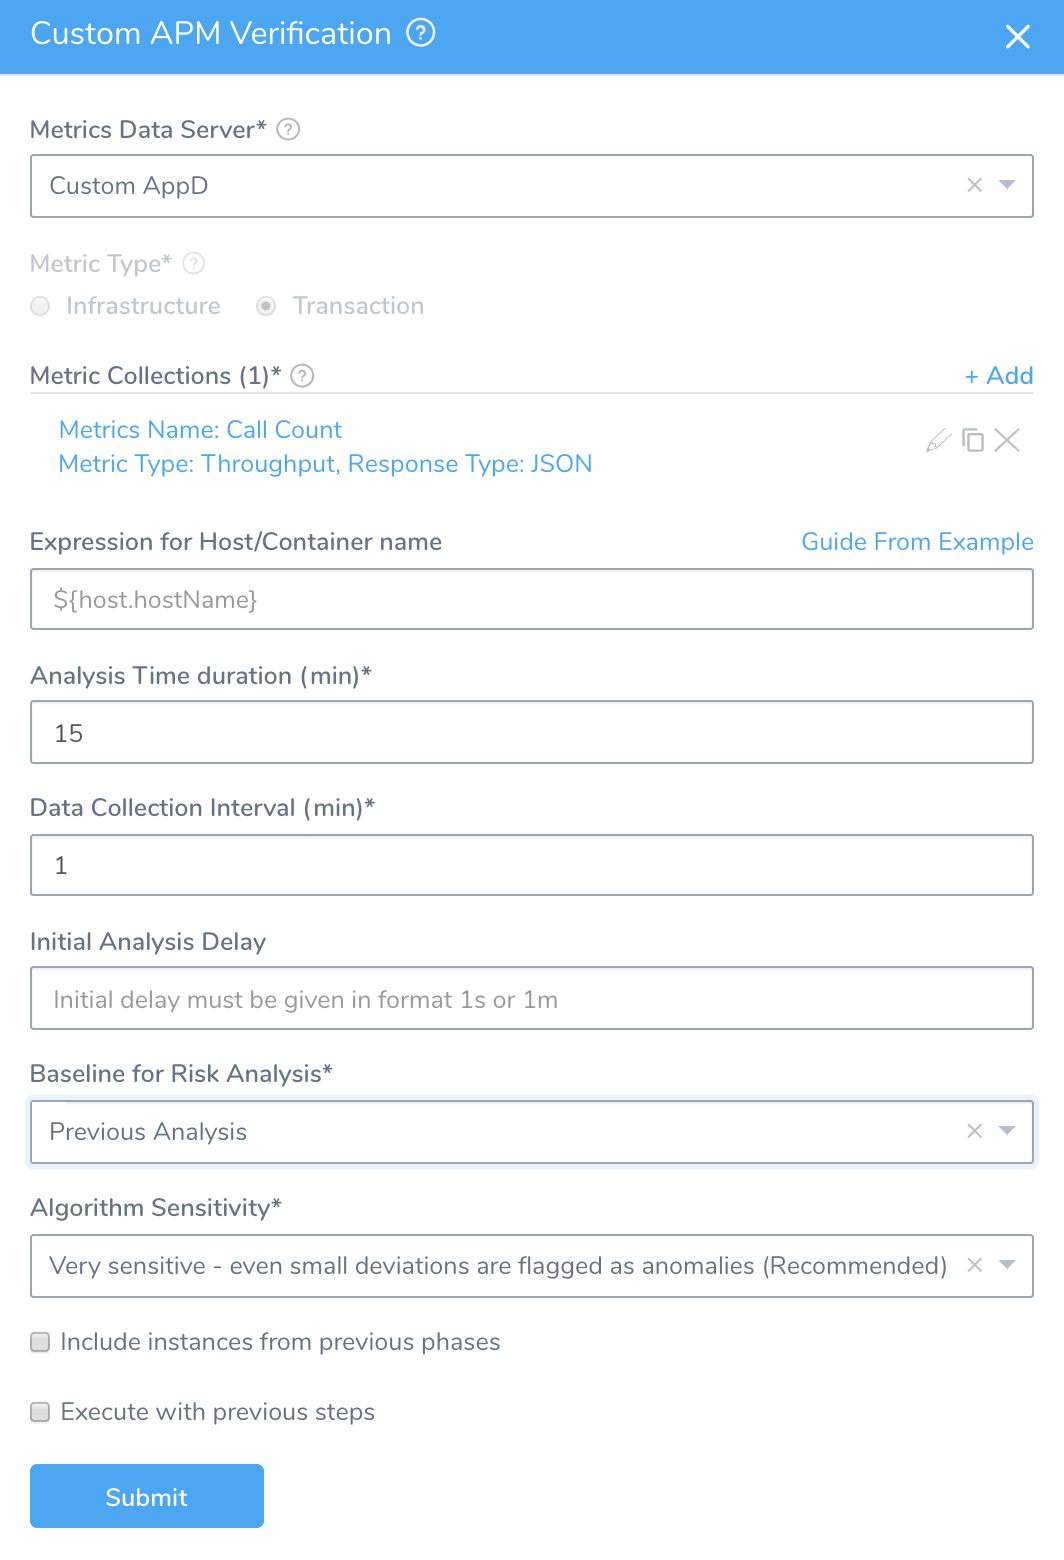
Step 14: Expression for Host/Container Name
The expression entered here should resolve to a host/container name in your deployment environment. By default, the expression is ${host.hostName}.
Step 15: Analysis Time Duration
Set the duration for the verification step. If a verification step exceeds this value, the Workflow's Failure Strategy is triggered. For example, if the Failure Strategy is Ignore, then the verification state is marked Failed, but the Workflow execution continues.
Step 16: Data Collection Interval
Specify how often Harness will collect data. For example, when the interval is 1 (1 minute), Harness will collect every minute. If it's 3, we will collect every 3 minutes. If your total duration is 15 minutes and the interval is 3 minutes, Harness will collect every 3 minutes for a total of 5 times over 15 minutes. Harness recommends the value 2.
Step 17: Baseline for Risk Analysis
See CV Strategies, Tuning, and Best Practices.
Step 18: Algorithm for Sensitivity
Harness recommends that you normally accept this drop-down's Very sensitive default. If your analysis needs differ, you can flag fewer deviations as anomalies by instead selecting Moderately sensitive or Least sensitive.
Step 19: Include instances from previous phases
If you are using this verification step in a multi-phase deployment, select this checkbox to include instances used in previous phases when collecting data. Do not apply this setting to the first phase in a multi-phase deployment.
Step 20: Execute with previous steps
Enable this check box to run this verification step in parallel with the previous steps in Verify Service.
When you've entered all your Custom APM Verification settings, they will look something like this:
Click Submit. The AppDynamics Custom verification step is now added to the Workflow. Run your Workflow to see the results.