Verify Deployments with Custom Logs
The following procedure describes how to add a custom Logs verification step in a Harness Workflow. For more information about Workflows, see Add a Workflow.
Once you run a deployment and your custom logs provider obtains its data, Harness machine-learning verification analysis will assess the risk level of the deployment using the data from the provider.
In order to obtain the names of the host(s), pod(s), or container(s) where your service is deployed, the verification provider should be added to your Workflow after you have run at least one successful deployment.
Before You Begin
Step 1: Set Up the Deployment Verification
To verify your deployment with a custom metric or log provider, do the following:
Ensure that you have added Custom Logs Provider as a verification provider, as described in Connect to Custom Verification for Custom Logs.
In your workflow, under Verify Service, click Add Verification.
In the resulting Add Step settings, select Log Analysis > Custom Log Verification.
Click Next. The Configure Custom Log Verification settings appear.
In Log Data Provider, select the custom logs provider you added, described in Connect to Custom Verification for Custom Logs.
Click Add Log Collection to add a Log Collection section.

Step 2: Request Method
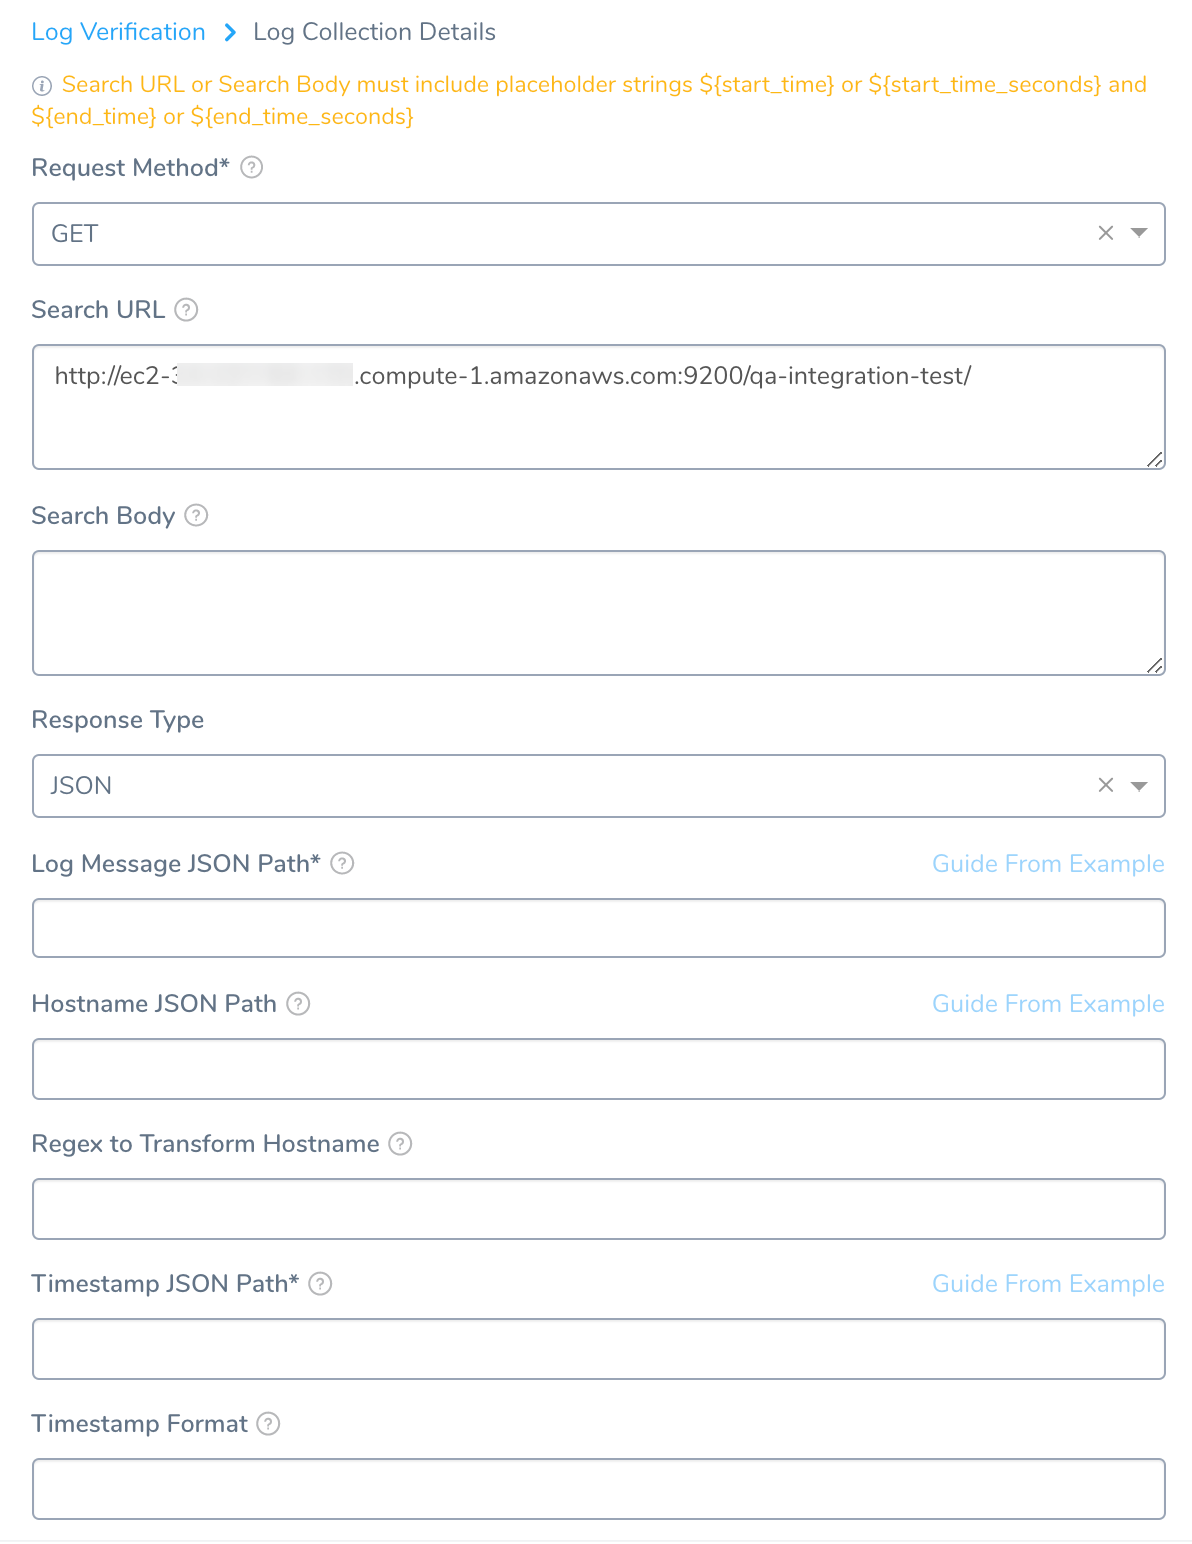
In Request Method, select GET or POST.
Step 3: Search URL
In Search URL, enter the API query that will return a JSON response.
Make sure the following parameters are included in the query. These placeholders will be replaced with the actual values during the execution.
${start_time}or${start_time_seconds}: This is the placeholder parameter to specify the start time of the query. It is similar to the value specified in custom metrics verification.${end_time}or${end_time_seconds}: This is the placeholder parameter to specify the end time of the query. It is similar to the value specified in custom metrics verification.${host}: This is the placeholder for querying based on the host during deployment verification. This is NOT a required field if the setup is for a Previous Analysis.
In the remaining settings, you will map the keys in the JSON response to Harness settings to identify where data—such as log message and timestamp—are located in the JSON response.
Step 4: Search Body
In Search Body, enter any JSON search input for your query. If you need to send a token, but do not want to send it in plaintext, you can use a Harness encrypted text secret.
Step 5: Response Type
In Response Type, select JSON.
Step 6: Log Message JSON Path
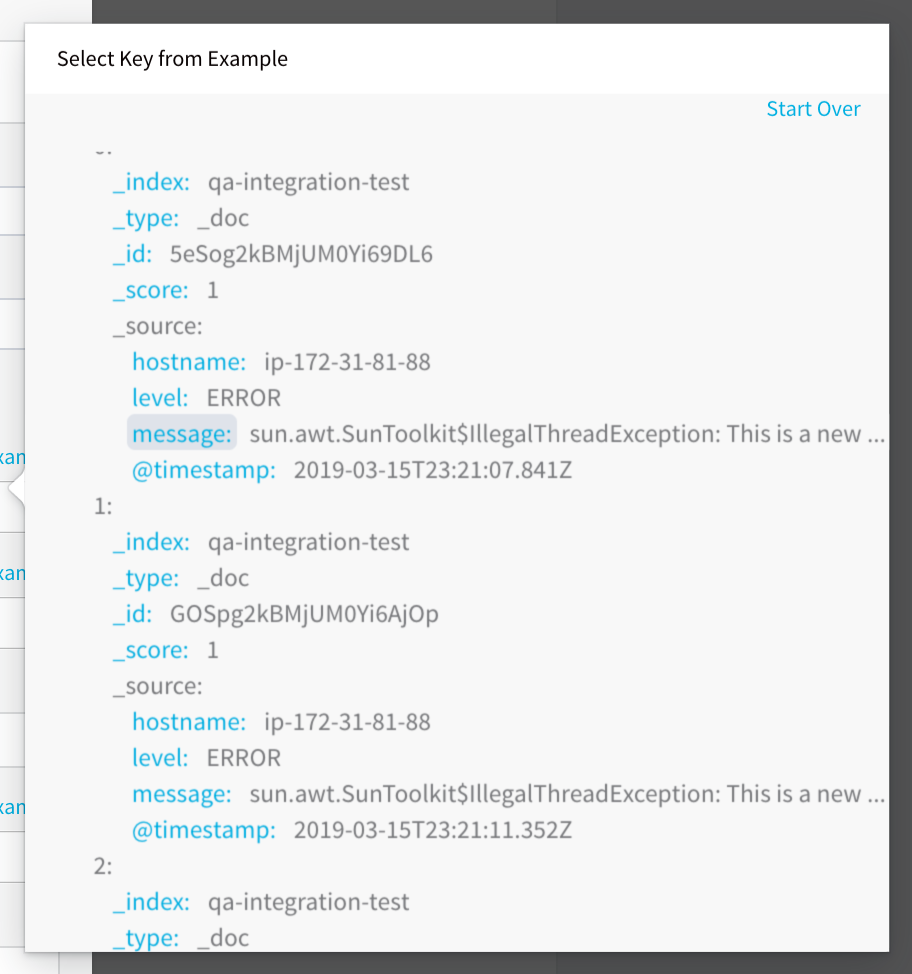
In Log Message JSON Path – Use Guide from Example to query the log provider and return the JSON response.

The URL is a combination of the Verification Cloud Provider Base URL and the Log Collection URL you entered.
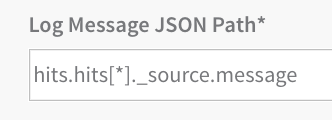
Click SEND. In the JSON response, click the key that includes the log message path.

The log message path key is added to Log Message JSON Path:

Step 7: Hostname JSON Path
Use Guide from Example to query the log provider and return the JSON response. In the JSON response, click the key that includes the hostname path.
Step 8: Regex to Transform Host Name
If the JSON value returned requires transformation in order to be used, enter the regex expression here. For example: If the value in the host name JSON path of the response is pod_name:harness-test.pod.name and the actual pod name is simply harness-test.pod.name, you can write a regular expression to remove the pod_name from the response value.
Step 9: Timestamp JSON Path
Use Guide from Example to query the log provider and return the JSON response. In the JSON response, click the key that includes the timestamp.

Step 10: Timestamp Format
Enter the format of the timestamp included in the query request (not response). The format follows the Java SimpleDateFormat. For example, a timestamp syntax might be yyyy-MM-dd'T'HH:mm:ss.SSSX. If you leave this field empty, Harness will use the default range of 1 hour previous (now - 1h) to now.
Click Add. The Log Collection is added.
Step 11: Expression for Host/Container
The expression entered here should resolve to a host/container name in your deployment environment. By default, the expression is ${instance.host.hostName}.
Step 12: Analysis Time Duration
Set the duration for the verification step. If a verification step exceeds the value, the workflow Failure Strategy is triggered. For example, if the Failure Strategy is Ignore, then the verification state is marked Failed but the workflow execution continues.
Harness waits 2-3 minutes before beginning the analysis to avoid initial deployment noise. This is a standard with monitoring tools.
Step 13: Data Collection Interval
Specify the frequency at which Harness will run the query. Harness recommends the value 2.
Step 14: Baseline for Risk Analysis
See CV Strategies, Tuning, and Best Practices.
Step 15: Execute with previous steps
Check this checkbox to run this verification step in parallel with the previous steps in Verify Service.
Step 16: Include instances from previous phases
If you are using this verification step in a multi-phase deployment, select this checkbox to include instances used in previous phases when collecting data. Do not apply this setting to the first phase in a multi-phase deployment.
Step 17: Wait interval before execution
Set how long the deployment process should wait before executing the verification step.
Review: Additional Notes
The Compare With Previous Run option is used for Canary deployments where the second phase is compared to the first phase, and the third phase is compared to the second phase, and so on. Do not use this setting in a single phase workflow or in the first phase of a multi-phase workflow.