Monitor Applications 24/7 with Custom Logs
Harness 24/7 Service Guard monitors your live applications, catching problems that surface minutes or hours following deployment. For more information, see 24/7 Service Guard Overview.
While Harness supports all of the common logging tools, you can add your Custom logging to Harness 24/7 Service Guard in your Harness Application Environment. For a setup overview, see Connect to Custom Verification for Custom Logs.
This section assumes you have a Harness Application set up, containing a Service and Environment. For steps on setting up a Harness Application, see Application Components.
Before You Begin
Step 1: Set up 24/7 Service Guard for Custom Logs
To set up 24/7 Service Guard for custom logs, do the following:
Ensure that you have added your Custom Verification provider as a Harness Verification Provider, as described in Verification Provider Setup.
In your Harness Application, ensure that you have added a Service, as described in Services. For 24/7 Service Guard, you do not need to add an Artifact Source to the Service, or configure its settings. You simply need to create a Service and name it. It will represent your application for 24/7 Service Guard.
In your Harness Application, click Environments.
In Environments, ensure that you have added an Environment for the Service you added. For steps on adding an Environment, see Environments.
Click the Environment for your Service. Typically, the Environment Type is Production.
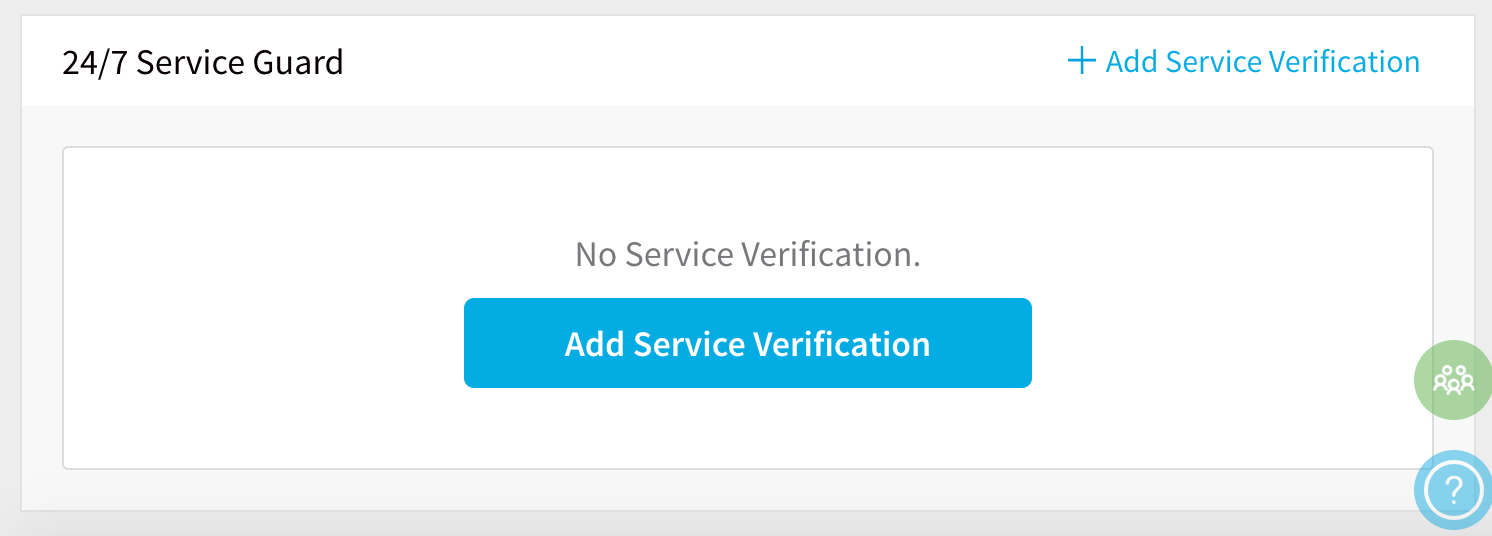
In the Environment page, locate 24/7 Service Guard.

In 24/7 Service Guard, click Add Service Verification, and then click Custom Log Verification.
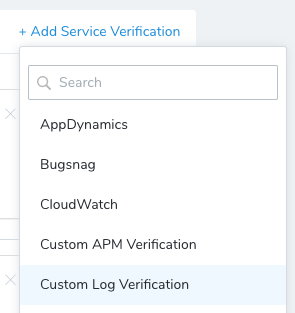
The Custom Log Verification dialog appears.
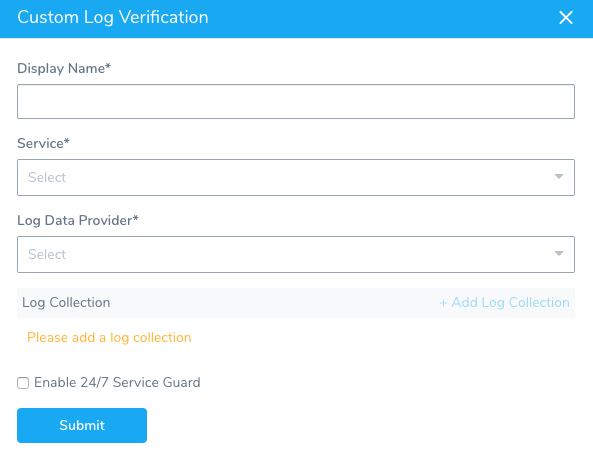
Fill out the dialog. The dialog has the following fields.
For 24/7 Service Guard, the queries you define to collect logs are specific to the application or service you want monitored. Verification is application/service level. This is unlike Workflows, where verification is performed at the host/node/pod level.
Step 2: Display Name
Enter a name for this 24/7 Service Guard monitoring. This name will identify the monitoring in the Environment page and in 24/7 Service Guard under Continuous Verification.
Step 3: Service
Select the Harness Service that represents the production application you are monitoring with the custom log provider.
Step 4: Log Data Provider
Select the Custom Logs Provider you added, described in Connect to Custom Verification for Custom Logs.
Step 5: Log Collection
Once you have added log collection details, this section will list the collection settings.
Step 6: Request Method
Select GET or POST. If you select POST, Search Body field is mandatory. In Search Body, you can enter any HTTP body to send as part of the query.
Step 7: Search URL
Enter the API query that will return a JSON response. In the remaining settings, you will map the keys in the JSON response to Harness settings to identify where data such as the hostname and timestamp are located in the JSON response.
The Search URL is automatically filled with the URL from the Custom Log Provider you selected in Log Data Provider:
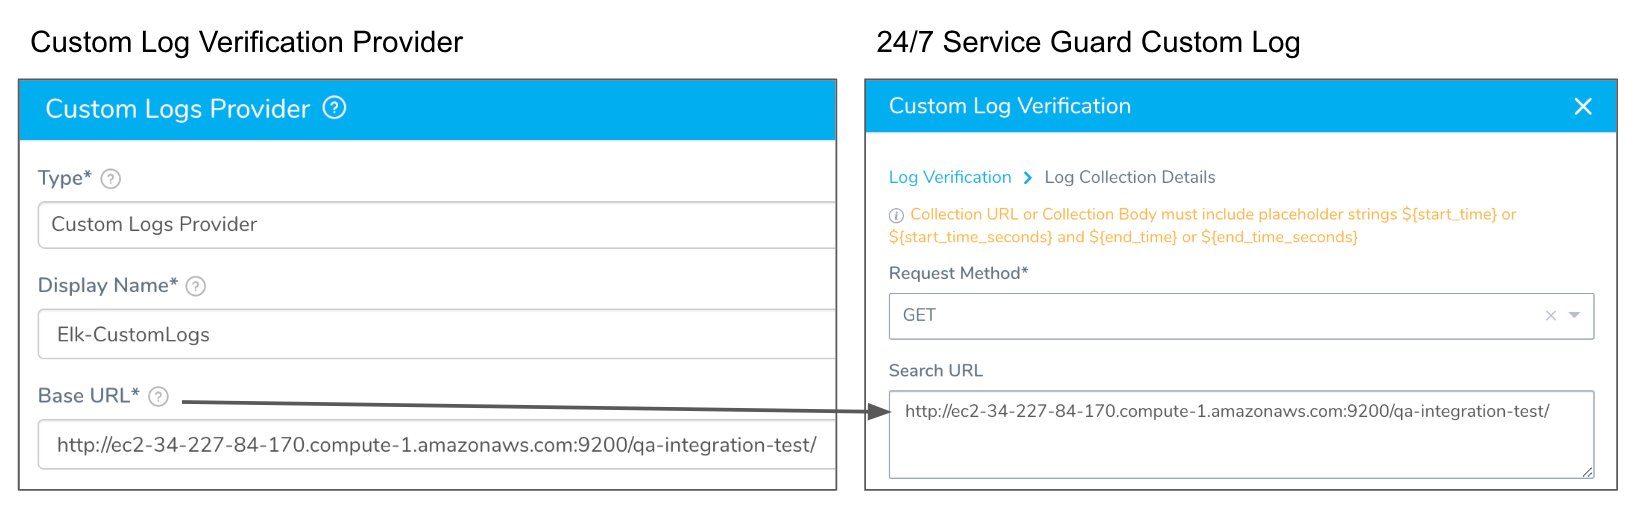
For some custom logging tools, you will need to augment your Base URL with query or some other setting. For example: https://www.scalyr.com/api/query.
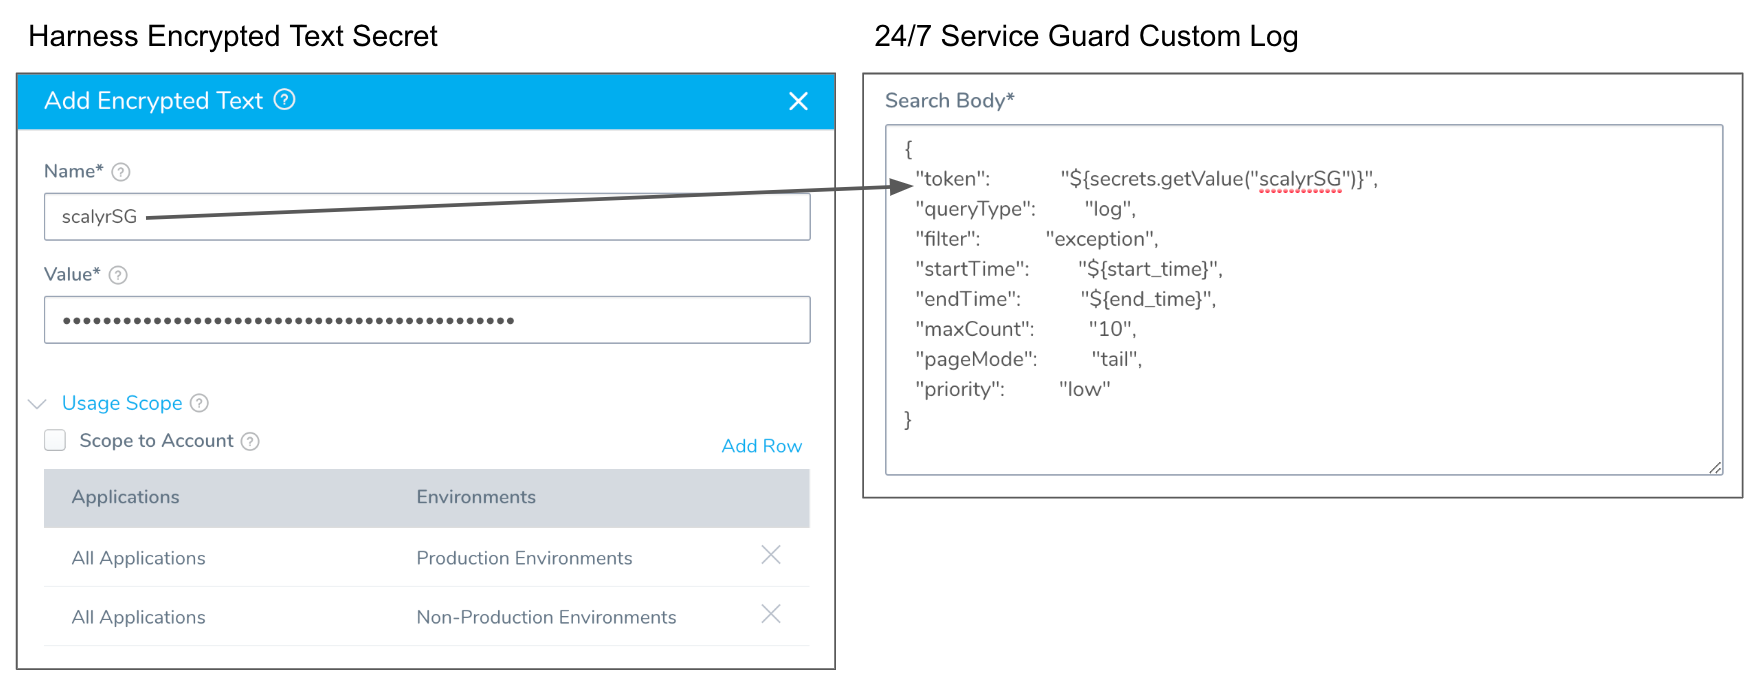
Step 8: Search Body
You can enter any JSON search input for your query. For example, here is a log query for logs in Scalyr:
{
  "token":           "${secrets.getValue("scalyrSG")}",
  "queryType":         "log",
  "filter":            "exception",
  "startTime":         "${start\_time}",
  "endTime":           "${end\_time}",
  "maxCount":          "10",
  "pageMode":          "tail",
  "priority":          "low"
}
You can see that the token field uses a Harness Encrypted Text secret containing the token, referenced using the syntax ${secrets.getValue("secret-name")}.
Step 9: Response Type
In Response Type, select JSON.
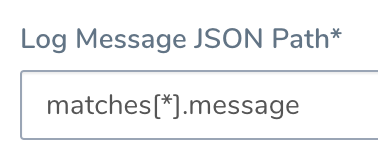
Step 10: Log Message JSON Path
To use Guide From Example, your Search URL or Search Body must contain the start and end time placeholders ${start_time} and ${end_time}.
Where the start and end time placeholders are required depends on your custom logs provider. For example, some providers will need them in the Search Body and other in the Search URL.
Click Guide From Example. A popup appears, preset for you to query the provider.
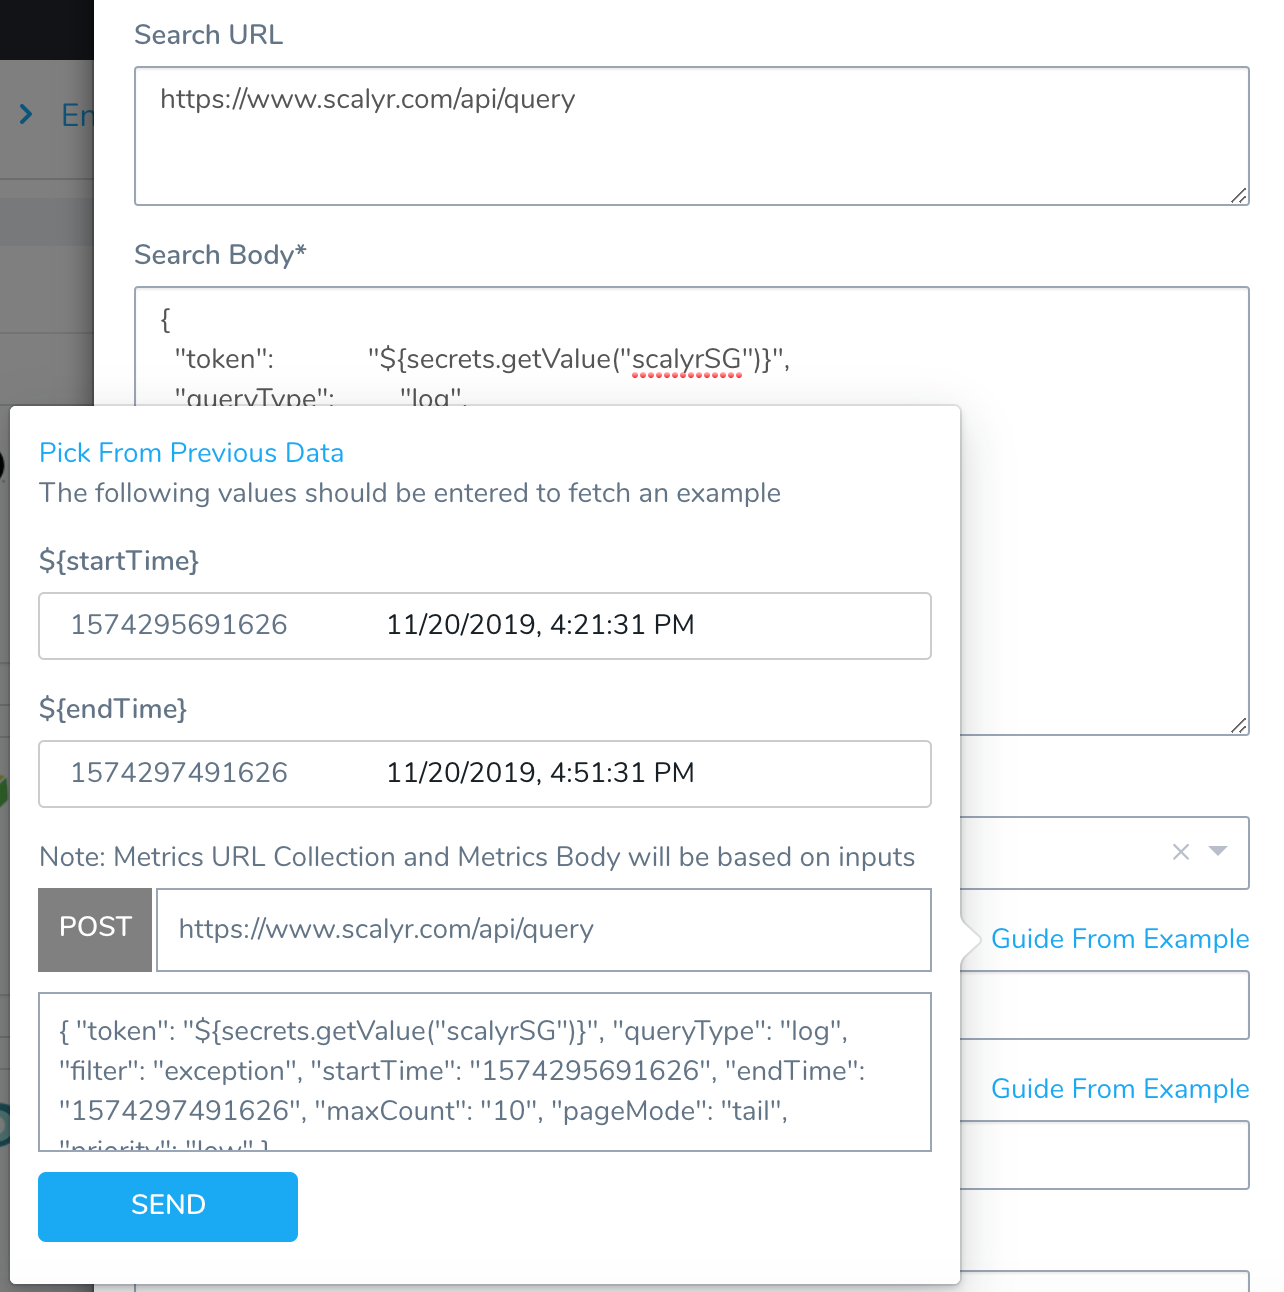
You can change the start and end times. By default, they are set for the last 30 minutes.
Click SEND. The JSON response is displayed.
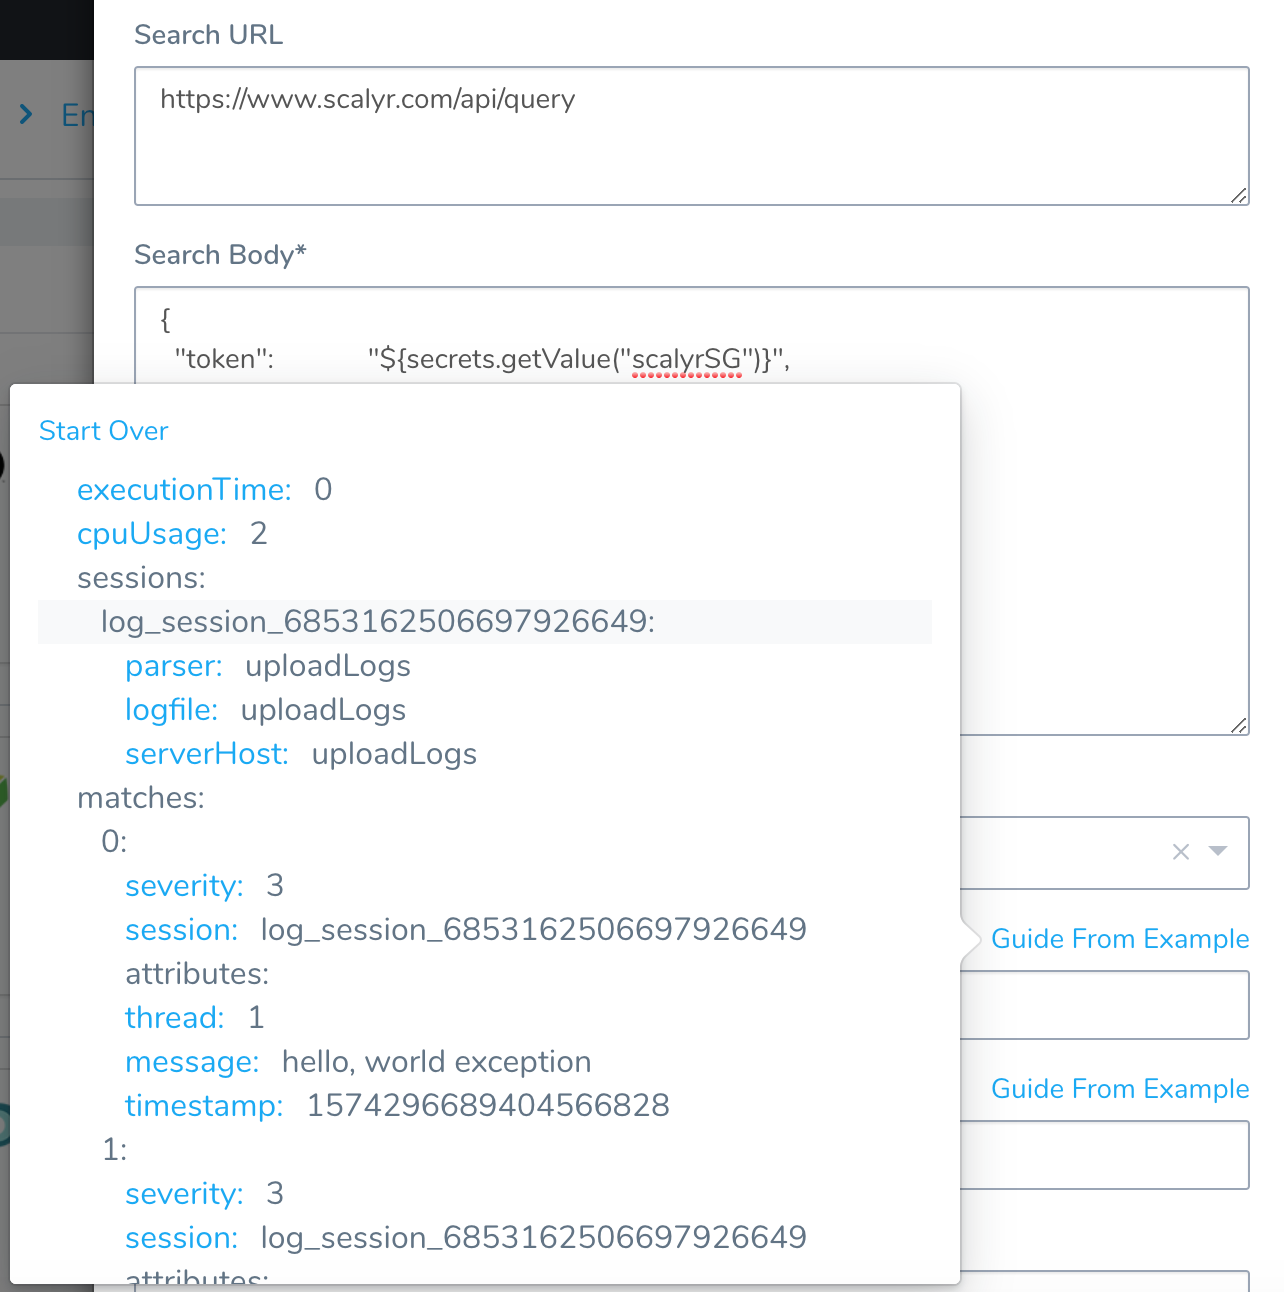
Click the message field. The JSON path is added to Log Message JSON Path:
Step 11: Service Instance JSON Path
Click Guide From Example to locate the JSON path for the service instance. If the JSON returned by your query does not have the path, then leave Service Instance JSON Path empty.
Step 12: Regex to Transform Hostname
If the JSON value returned requires transformation in order to be used, enter the regex expression here. For example: If the value in the host name JSON path of the response is pod_name:harness-test.pod.name and the actual pod name is simply harness-test.pod.name, you can write a regular expression to remove the pod_name from the response value.
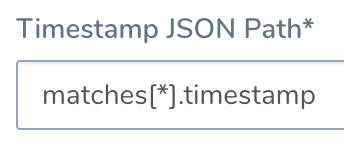
Step 13: Timestamp JSON Path
Click Guide From Example to locate the JSON path for the timestamp, and click the timestamp label.
Step 14: Timestamp Format
Enter a timestamp format. The format follows the Java SimpleDateFormat. For example, a timestamp syntax might be yyyy-MM-dd'T'HH:mm:ss.SSSX. If you leave this field empty, Harness will use the default range of 1 hour previous (now - 1h) to now.
Step 15: Enable 24/7 Service Guard
Select Enable 24/7 Service Guard to enable monitoring.
Step 16: Baseline
When you select Enable 24/7 Service Guard, you can select a baseline time interval for monitoring.
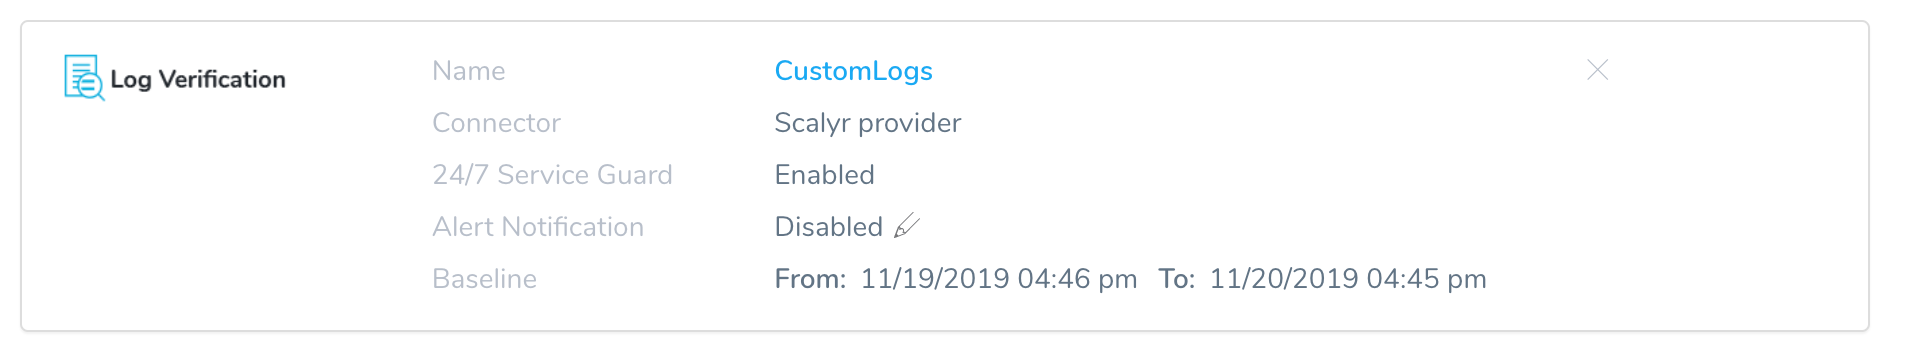
When you have added your Log Collection your Custom Log Verification will look something like this:
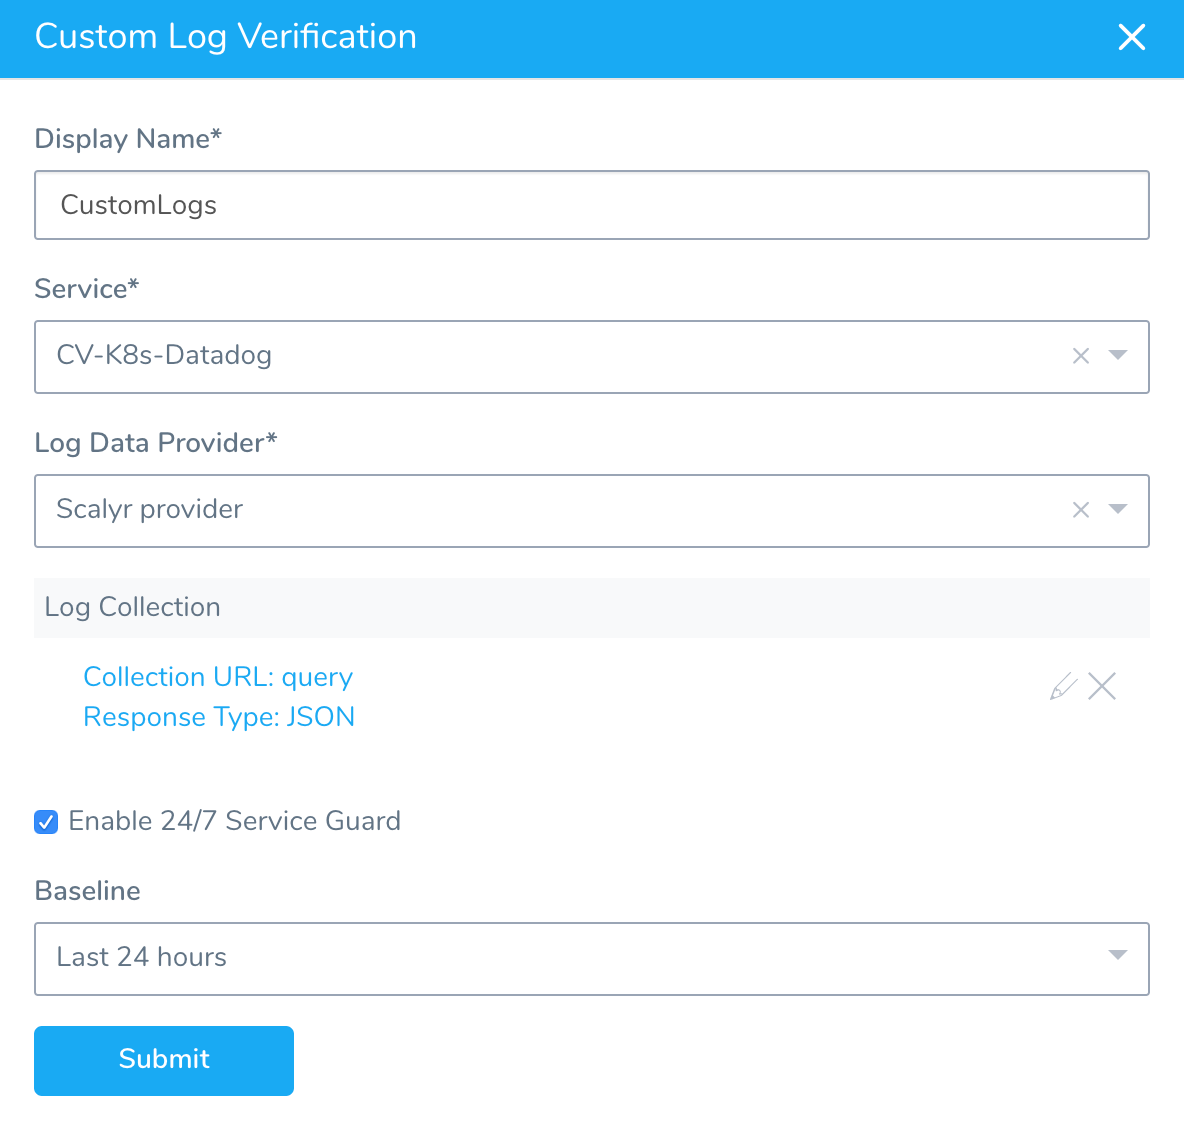
The Custom Logs Verification is added to 24/7 Service Guard: