Verify Deployments with Custom Metrics
This topic describes how to add a custom APM (metrics) verification step in a Harness Workflow. For more information about Workflows, see Add a Workflow.
Once you run a deployment and your custom metrics provider obtains its data, Harness machine-learning verification analysis will assess the risk level of the deployment using the data from the provider.
In order to obtain the names of the host(s), pod(s), or container(s) where your service is deployed, the verification provider should be added to your Workflow after you have run at least one successful deployment.
Before You Begin
Step 1: Set Up the Deployment Verification
To verify your deployment with a custom metric or log provider, do the following:
Ensure that you have added Custom Metrics Provider as a verification provider, as described in Connect to Custom Verification for Custom Metrics.
In your workflow, under Verify Service, click Add Verification.
In the resulting Add Step settings, select Performance Monitoring > Custom Metrics.
Click Next. The Configure**Custom Metrics** settings appear.
In Metrics Data Provider, select the custom metric provider you added, described in Connect to Custom Verification for Custom Metrics.
In Metrics Type, select Infrastructure or Transaction.
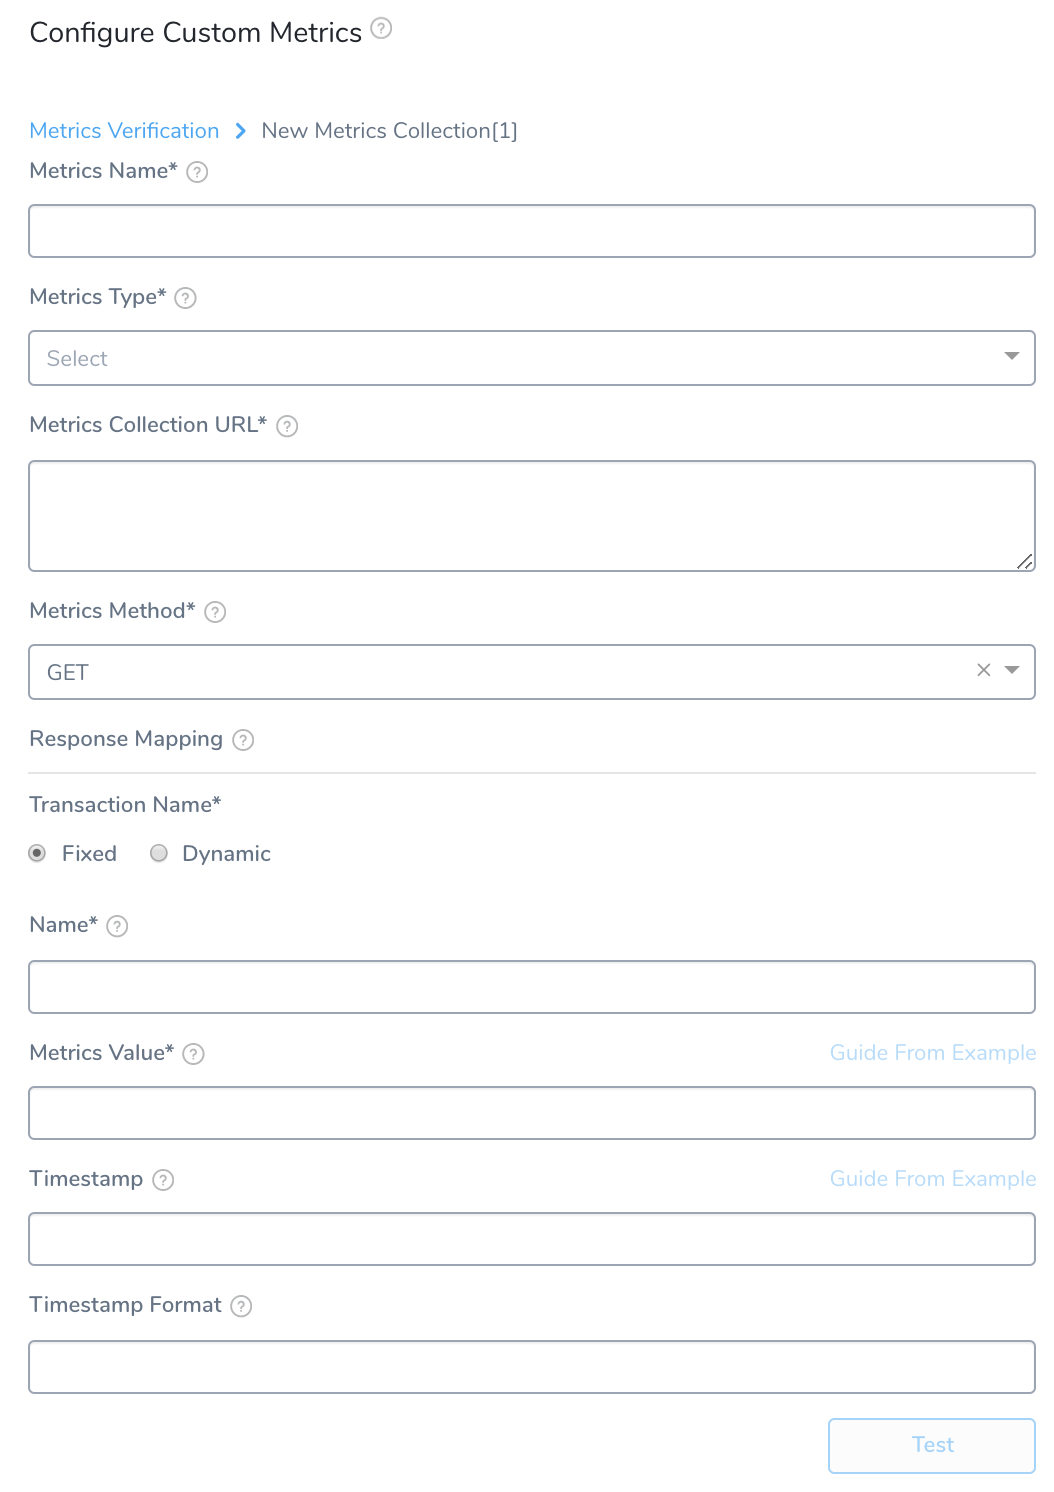
Add a Metric Collections section.
Step 2: Metrics Name
Enter a name for the type of error you are collecting, such as HttpErrors.
Step 3: Metrics Type
For the Infrastructure Metrics Type, select the type of metric you want to collect:
- Infra -–Infrastructure metrics, such as CPU, memory, and HTTP errors.
- Value – Apdex (measures user satisfaction with response time).
- Lower Value – Values below the average.
For the Transaction Metrics Type, select the type of metric you want to collect:
- Error
- Response Time
- Throughput
Always Use Throughput with Error and Response Time Metrics
Whenever you use the Error metric type, you should also add another metric for Throughput with the same Transaction Name.

Harness analyze errors as error percentage and without the throughput the error number does not provide much information.
The same setup should used with the Response Time metric also. Whenever you set up a Response Time metric, setup a Throughput metric with the same Transaction Name.

Step 4: Metrics Collection URL
Enter a query for your verification. You can simply make the query in your Verification Provider and paste it in this field. For example, in New Relic Insights, you might have the following query:
You can paste the query into the Metrics Collection URL field:
For information on New Relic Insights NRSQL, see NRQL syntax, components, functions from New Relic.The time range for a query (SINCE clause in our example) should be less than 5 minutes to avoid overstepping the time limit for some verification providers.
Most often, when you create your query, you will include a hostname placeholder in the query, ${host}. This placeholder will be used later when setting up the Metrics Value and other settings that use Guide from an example.
For example, if your query is:
SELECT count(host) FROM Transaction SINCE 30 MINUTES AGO COMPARE WITH 1 WEEK AGO WHERE host = '37c444347ac2' TIMESERIES
Then you replace the host name with the ${host} placeholder and paste the query into Metrics Collection URL:
SELECT count(host) FROM Transaction SINCE 30 MINUTES AGO COMPARE WITH 1 WEEK AGO WHERE host = '${host}' TIMESERIES
Make sure the ${start_time_seconds} and ${end_time_seconds} parameters are included in the query.
These variables define a 1-minute interval from the time the Workflow Verification starts. To modify the time interval, click Edit Step > APM > Custom and update the Data Collection Interval in minutes field.
An example part of the query with these values appears as follows:
from=${start_time_seconds}&to=${end_time_seconds}
For verification providers that accept values in milliseconds, you can use the ${start_time} and ${end_time} variables.
Step 5: Metrics Method
Select GET or POST. If you select POST, the Metric Collection Body field appears.
In Metric Collection Body, enter the JSON body to send as a payload when making a REST call to the APM Provider. The requirements of the JSON body will depend on your APM provider.
You can use variables you created in the Service and Workflow in the JSON, as well as Harness built-in variables.
Step 6: Response Mapping Transaction Name
These settings are for specifying which JSON fields in the responses to use.
Select Fixed or Dynamic.
Fixed: Use this option when all metrics are for the same transaction. For example, a single login page.
Dynamic: Use this option when the metrics are for multiple transactions.
Step 7: Name
Fixed
Enter the name with which you want to identify the transaction.
Step 8: Transaction Name Path
Dynamic
This is the JSON label for identifying a transaction name. In the case of our example New Relic Insights query, the FACET clause is used to group results by the attribute transactionName. You can obtain the field name that records the transactionName by using the Guide from an example feature:
Click Guide from an example. The Select Key from Example popover appears.
The Metrics URL Collection is based on the query you entered in the Metric Collection URL field earlier.
In ${host}, select a host to query. Click the query next to GET to see how the host you selected replaces the
${host}placeholder in your query.Click SEND. The query is executed and the JSON is returned.
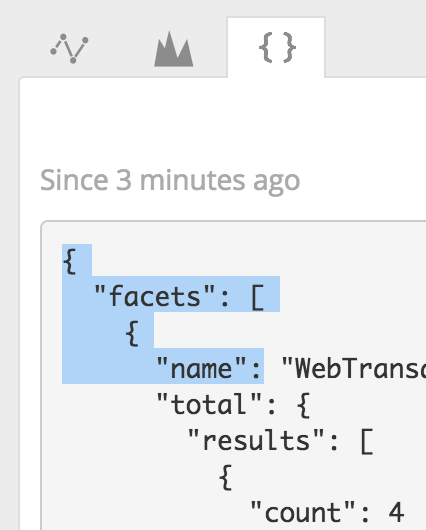
Locate the field name that is used to identify transactions. In our New Relic Insights query, it is the facets.name field.
If no metrics are found, you will see aMETRIC DATA NOT FOUNDerror.
In New Relic Insights, you can find the name in the JSON of your query results.Click the field name under facets. The field path is added to the Transaction Name Path field.
Step 9: Regex to transform Transaction Name
Dynamic
Enter a regex expression here to obtain the specific name from the transaction path.
For example, if your Transaction Name Path JSON evaluated to a value such as name : TxnName, you can write a regex to remove everything other than TxnName.
For example (name:(.*),) or (?<=:).*(?=,).
Step 10: Metrics Value
Specify the value for the event count. This is used to filter and aggregate data returned in a SELECT statement. To find the correct label for the value, do the following:
Click Guide from an example. The example popover appears.
The Metrics URL Collection is based on the query you entered in the Metric Collection URL field earlier. The ${host} field refers to the${host}variable in your query.Click Submit. The query is executed and the JSON is returned.
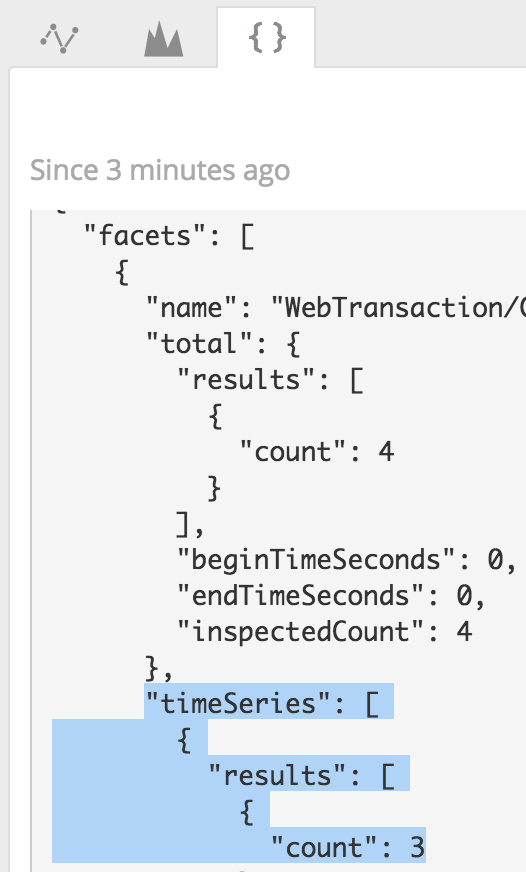
If no metrics are found, you will see aMETRIC DATA NOT FOUNDerror.Locate the field name that is used to count events. In our New Relic Insights query, it is the facets.timeSeries.results.count field.
In New Relic Insights, you can find the name in the JSON of your query results.Click the name of the field count. The field path is added to the Metrics Value field.
Step 11: Hostname JSON path
(Displayed if ${host} is present in the Metrics Collection URL query)
Use Guide from an example to select a host and query your APM. Click the name of the hostname JSON label in the response.
If there is no hostname in the response, leave this setting empty.
Step 12: Timestamp
Specify the value for the timestamp in the query. To find the correct label for the value, do the following:
Click Guide from an example. The Select Key from Example popover appears.
The Metrics URL Collection is based on the query you entered in the Metric Collection URL field earlier.Click Submit. The query is executed and the JSON is returned.
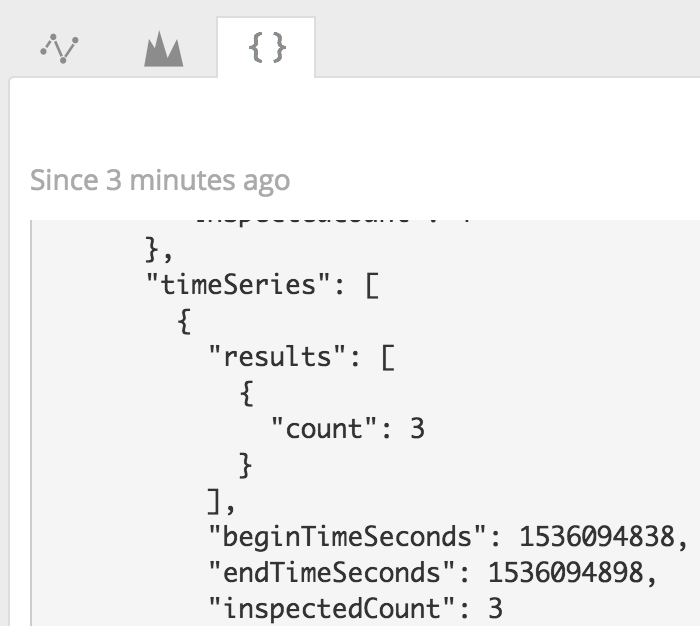
Locate the field name that is used for the time series endTimeSeconds. In our New Relic Insights query, it is the facets.timeSeries.endTimeSeconds field.
In New Relic Insights, you can find the name in the JSON of your query results.Click the name of the field endTimeSeconds. The field path is added to the Timestamp field.
Step 13: Timestamp Format
Enter the format of the timestamp included in the query request (not response), set in Timestamp. The format follows the Java SimpleDateFormat. For example, a timestamp syntax might be yyyy-MM-dd'T'HH:mm:ss.SSSX. If you leave this field empty, Harness will use the default range of 1 hour previous (now-1h) to now.
When you are done, the settings will look something like this:
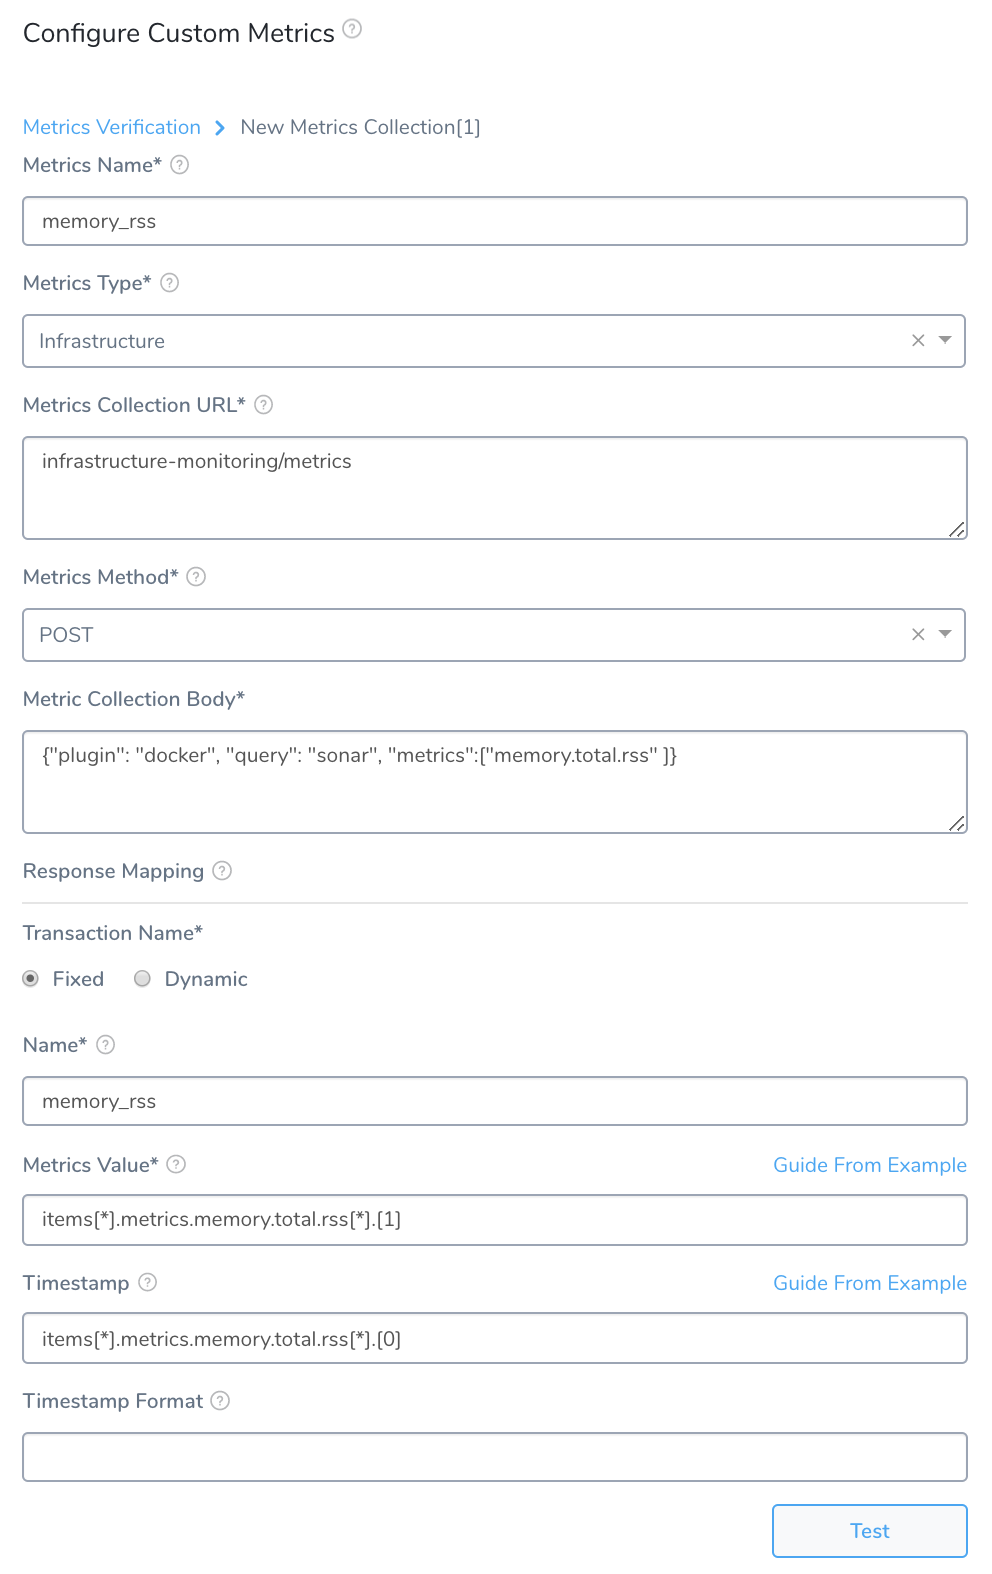
Click Test and then click Add.
Step 14: Custom Thresholds
In the Configure**Custom Metrics dialog, you can access the Custom Thresholds** section once you have configured at least one Metrics Collection. You can use Custom Thresholds to define two types of rules that override normal verification behavior:
- Ignore Hints that instruct Harness to skip certain metrics/value combinations from verification analysis.
- Fast-Fail Hints that cause a Workflow to enter a failed state.
For details about defining Custom Thresholds, see Apply Custom Thresholds to Deployment Verification.
In deployment, where a Fast-Fail Hint moves a Workflow to a failed state, the Workflow's Details panel for that Verification step will indicate the corresponding threshold.
Step 15: Expression for Host/Container
The expression entered here should resolve to a host/container name in your deployment environment. By default, the expression is ${instance.host.hostName}.
Step 16: Analysis Time Duration
Set the duration for the verification step. If a verification step exceeds the value, the workflow Failure Strategy is triggered. For example, if the Failure Strategy is Ignore, then the verification state is marked Failed but the workflow execution continues.
Harness waits 2-3 minutes before beginning the analysis to avoid initial deployment noise. This is a standard with monitoring tools.
Step 17: Data Collection Interval
Specify the frequency at which Harness will run the query. Harness recommends the value 1 (1 minute).
If the data collection interval is greater than 1 minute, Harness expects a response with multiple timestamped rows to be returned (1 per minute). This is to avoid losing granularity.
Step 18: Baseline for Risk Analysis
See CV Strategies, Tuning, and Best Practices.
Step 19: Execute with previous steps
Check this checkbox to run this verification step in parallel with the previous steps in Verify Service.
Step 20: Failure Criteria
Specify the sensitivity of the failure criteria. When the criteria is met, the workflow Failure Strategy is triggered.
Step 21: Include instances from previous phases
If you are using this verification step in a multi-phase deployment, select this checkbox to include instances used in previous phases when collecting data. Do not apply this setting to the first phase in a multi-phase deployment.
Step 22: Wait interval before execution
Set how long the deployment process should wait before executing the verification step.
Review: Additional Notes
- Depending on the custom metric provider you select, you might need to provide different information to the Metric Collections section. For example, you might need to provide a hostname for the Guide from an example popover to use to retrieve data. The hostname will be the host/container/pod/node name where the artifact is deployed. In you look in the JSON for the deployment environment, the hostname is typically the name label under the host label.
- The Compare With Previous Run option is used for Canary deployments where the second phase is compared to the first phase, and the third phase is compared to the second phase, and so on. Do not use this setting in a single phase workflow or in the first phase of a multi-phase workflow.


